I always love to find a new nonfiction sports book to add to our sports basket, so I bought this one when I saw it. Sports Illustrated for Kids seems to publish stuff that is really interesting for kids. I figured (just by the cover) that kids would like
Baseball: Then to Wow! but when I opened it I realized how packed it was with single-page spreads that I could use for mini lessons and small group instruction too.
The visuals in this book are BRILLIANT. Every page focuses on a different topic and then shows how things have changed over the years. Some pages, show a timeline--for example the page on Catcher's Masks starts in the 1870s and goes decade by decade showing what they looked like and some facts about them over the years. Another page, The Five-Tool Player compares two players in a Then and Now table. Mickey Mantle and Mike Trout.
I don't know a lot about baseball but this book is engaging as a reader because of the amount of information and the way it is displayed. There is a lot for kids in this book. First of all, I think they will just enjoy it for the book that it is. It is a great read packed with fascinating info. As readers, they can learn a lot about how to read visuals--there is such a variety of visual information that I can see using several pages in lessons as we learn to navigate nonfiction. I also think as writers, they'll want to try some things out. I have lots of kids who write about sports and start out in pretty traditional ways. This gives them new ways to think about how they might best share information with readers.
This book is packed with information as well as real photos, artifacts, maps and more. It is definitely going to be one of my go-to nonfiction texts next year. (If you go to the book on Amazon, you can "Look Inside" and see some of the visuals.)
Throughout April, we are exploring how Jan Reynolds’ Vanishing Cultures series can be used in the classroom to teach about the environment, geo-literacy, global citizenship, and nonfiction. Today, we want to share how one school has integrated geo-literacy with digital and visual literacy.
Michael Willis and the Kaleidoscope Team at Williston Central School in Williston, Vermont helped their 3rd and 4th grade classroom build a map on Google Maps of the cultures featured in the books. Through this project, students were able to investigate topics and themes in the Vanishing Cultures series, practice deriving information from other formats and develop visual literacy skills, and gain rich social studies/ geography content knowledge.
The Google Maps assignment is an exciting way to engage reluctant or struggling readers, facilitate the participation of visual learners and English Language Learners, or provide an extension opportunity for ready or advanced learners. The 3rd and 4th grade students hope that in addition to deepening their own knowledge about traditional cultures, their project provides useful and valuable information for others.
From educator, Michael Willis: My 3rd and 4th grade team wanted to get an author in to share their experiences with our young writers. Ideally we wanted a local person and sure enough Jan Reynolds, who lives in Vermont, was available. First we hit up our library as well as the others in our area and got our hands on Jan’s Vanishing Cultures series. We read aloud her books, visited her website, and then Jan came.
She shared a movie about her work and travels with our whole team in the auditorium and then spent time answering questions in smaller groups. It was during one of the small presentations that Jan mentioned how great it would be to use Google Maps to highlight her book locations. I thought it would be a great project for our students, and they were motivated to do it by the idea that the project could be shared with other students who read Jan’s books.
We used Google Maps to plot out where in the world Jan’s Vanishing Cultures books take place, and put together this map.
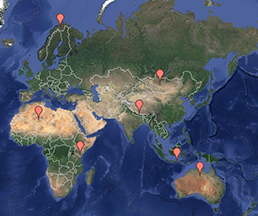
Williston Central School Google Earth Map for Vanishing Cultures series
Here’s what the students had to say about the project:
What was it like doing the Google Earth Project?
Grace – I thought that it was really fun because we were working with a famous author. We had to get all of her books and look up where she had been using Google Earth.
Isabelle – We dropped pins on the locations using the facts and map information on the inside covers of her books. Doing this project motivated us to have to read her books and learn about the cultures that she visited. It made me appreciate how lucky we are to have the things we have.
Logan – The map project was really interesting. It helped me understand how many different places Jan had been. I didn’t know that there were cultures vanishing from the Earth. It made me want to learn more about the cultures. The books were helpful because she had really been to visit the people, talk to them, and learn how they live.
Addie – We used the summaries and the content from the books to add a brief description to the pins which marked the places. This project motivated us because we wanted to help others learn. It felt special because we were the first ones to do this and actually get published! Plus, I didn’t even know these cultures existed!
Myleigh – The motivating part of the project was that I don’t usually get to explore the world. How often do people get to learn about this kind of thing? It was almost like traveling the world reading Jan’s books.
What do you think is the purpose of Jan’s books? What do they help you realize?
Sean – Her purpose was to teach children about the Vanishing Cultures and what is happening to them. I think Jan’s message was not that they need our help because they have been surviving for a long time. She was telling us that we should respect them, their way of life, and to respect their land. I learned that they are just like everyday people. To them, I bet we would look like the outsiders. Everyone has traditions that they do.
Addie – We are lucky to have so many resources to use.
Grace – It made me realize how different these cultures are from us
Isabelle – It also made me realize that we all are not that different. We may have different stuff and live in different parts of the world, but we all are people.
Grace – We can help other cultures by protecting the regions where they live
Addie – We realized that while our cultures are different, we shouldn’t force them to disappear because we all have something to learn from each other. We could be more conscious of our waste and our pollution and that could help them keep their culture and survive
Isabelle – I think that it is important to respect different cultures because it’s how they live. The Celebrations book helped me learn that different cultures celebrate different holidays
What was it like having Jan visit?
Myleigh – It was really cool to see Jan’s presentation and to hear her describe her trips first hand. It really helped me put myself in her shoes and understand what she was going through. When I was hearing her use such descriptive language it felt like I was right there with her.
Katrina – I think that since she came it really helped us understand that you should appreciate what you have – even though the people in the other cultures don’t have a lot they still seemed happy. The people in those cultures work hard to live off the land and work with nature by using their resources. It really helped me learn about cultures that I didn’t know about.
For more resources on the Vanishing Cultures series, check out:
How are you using the Vanishing Cultures series in your classroom? Share your thoughts, experiences, and strategies that have worked in your school and community! Post a comment below or email Lee & Low at [email protected].
Filed under:
Curriculum Corner Tagged:
CCSS,
children's books,
classroom projects,
close reading,
common core standards,
digital literacy,
diversity,
Educators,
ELA common core standards,
environmentalism,
geography,
geoliteracy,
reading comprehension,
visual literacy 

 Jill Eisenberg, our Resident Literacy Expert, began her career teaching English as a Foreign Language to second through sixth graders in Yilan, Taiwan as a Fulbright Fellow. She went on to become a literacy teacher for third grade in San Jose, CA as a Teach for America corps member. She is certified in Project Glad instruction to promote English language acquisition and academic achievement. In her column she offers teaching and literacy tips for educators.
Infographics’ format and economy of words make infographics engaging and accessible to children, reluctant readers, visual learners, and English Language Learners. As infographics contain multiple layers of information, they are a challenging medium for students to practice inferences and interpretation. Lee & Low Books’ infographic series on the diversity gap in major spheres of influence is a valuable vehicle to build students’ visual literacy skills and understanding of diversity. The following discussion questions and suggested activities were created based on the Diversity Gap in the Academy Awards infographic, but these can be applied to the rest of the series.
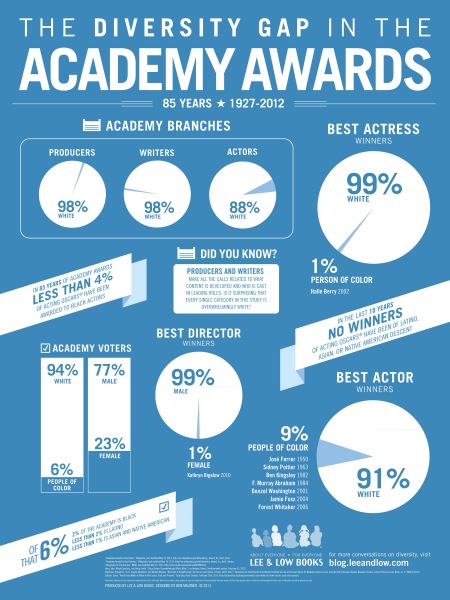
Infographic: The Diversity Gap in the Academy Awards (click to enlarge)
Discussion questions to consider with your students:
- What patterns do you see? What trends do you see? How are the different charts related?
- What is the central idea of this infographic? How do the words, phrases, and visuals interact to affirm the central idea?
- Based on the infographic, what does “diversity gap” mean in terms of the Academy Awards?
- What might the author’s purpose be in choosing this medium to convey the central idea (to shame, inspire, shock, etc.)?
- Does the infographic make the central idea clear and obvious? How does the infographic use an economy of words, language, typography, pie charts, bar graphs, negative space, and title to communicate the central idea?
- What type of infographic is this (flow chart, web, map, graph, diagram, table, timeline)? What might the author’s purpose be in choosing this type of infographic? How effective is this format of infographic at organizing and displaying data compared to just text?
- Evaluate the effectiveness of the infographic as a form of communication as compared to text alone. Is this the most effective and convincing way to convey information about a lack of diversity at the Academy Awards? Why or why not?
- Why might the creators have assembled this information about the Academy Awards and race at all?
- Who is the intended audience (moviegoers, actors, directors, writers, producers, movie studios, general public, government officials)? What might the creators of this infographic want them to do with this information?
- What is the context of this infographic? What major events in the United States were taking place when this infographic was created? Why is it important to understand the context of the infographic?
- Is this infographic’s argument and presentation persuasive or compelling? Why or why not? Analyze this infographic’s effectiveness in inspiring activism.
- Based on the information presented, what can you predict future trends will be for award winners, actors, directors, producers, and writers?
- Can you determine causes for the lack of diversity in this infographic? Why or why not? How might researchers go about figuring out the cause(s) for the historical and current lack of diversity in the Academy Awards?
- What is the impact of a lack of diversity amongst writers, actors, producers, directors, and award winners? What does it mean to be a young child growing up and consuming this form of media (movies)? What will they see? What will they not see? Tell me more about the possible effects of this situation and current trends.
Suggested activities:
- Challenge students to translate this infographic’s central idea into a written argument. Students should use key details and evidence from the infographic to assert the central idea.
- Have students revise or add on to make the infographic more effective. Students should consider format, adding or deleting information, and more. What would make the infographic stronger, more persuasive, or more memorable?
- Encourage students to investigate how these percentages compare to the general public. Students can use the United States Census data for demographics.
- Have students investigate possible causes for the lack of diversity in the Academy Awards. Urge students to propose ways to change these trends.
- If possible, ask students to research the percent of moviegoers who are people of color. Check industry publications or major news periodicals. How do these numbers compare to the information in the infographic?
- Permit students to interview their grade, class, or school on questions, including: Do you go to the movies? How often? What kinds of movies do you see? Who are your favorite actor and actress in Hollywood today? Who is a director/actor/actress of color that you have seen in a movie recently? Why do you think there aren’t more movies by and with people of color? Students can organize and display data in graphs and present findings to the class. Reflect on this information’s relationship to the infographic’s central idea.
- Dig deeper—investigate the artists that were nominated each year. How many were people of color over those 85 years? What roles did these artists play in the movies they were nominated for? What genres of movies were they in for this nomination? Explore the people of color who did win best actress or best actor. What roles did they play and what kind of movies were they in when they won for best acting?
- Compare this to other Lee & Low Books’ infographics in the series: The Tony Awards, The Emmy Awards, Children’s Book Publishing, The NY Times Top 10 Bestsellers List, and American Politics. Consider central idea, evidence, format, and audience.
- Update the information to include the 2013 and 2014 Academy Awards results. What changed? What did not change?
For further reading on teaching visual literacy and diversity in the classroom, check out these fantastic resources:
How are you building visual literacy skills in the classroom? Let us know below!
Filed under:
Curriculum Corner Tagged:
Academy Awards,
CCSS,
common core standards,
diversity,
Educators,
ELA common core standards,
History,
infographics,
Oscars,
Race issues,
reading comprehension,
teaching about race,
visual literacy 


.jpg?picon=1806)


Let's hope for a British win - at least one of them!
I don't agree with Cally, by the way - all kinds of factors will lead to e-books taking over from paper books, including economic, environmental, social and the fact that children can't learn to read on a screen the size of an iPhone so they will have to start with something larger format at least. Of course, it might just lead to reduced literacy, but I'm an optimist! Paper books may reduce in numbers but won't go away.
I'll be interested in seeing a pop-up ebook ... :-)