JacketFlap connects you to the work of more than 200,000 authors, illustrators, publishers and other creators of books for Children and Young Adults. The site is updated daily with information about every book, author, illustrator, and publisher in the children's / young adult book industry. Members include published authors and illustrators, librarians, agents, editors, publicists, booksellers, publishers and fans. Join now (it's free).
Login or Register for free to create your own customized page of blog posts from your favorite blogs. You can also add blogs by clicking the "Add to MyJacketFlap" links next to the blog name in each post.
Blog Posts by Tag
In the past 7 days
Blog Posts by Date
Click days in this calendar to see posts by day or month
Viewing: Blog Posts Tagged with: MNRAS, Most Recent at Top [Help]
Results 1 - 8 of 8
How to use this Page
You are viewing the most recent posts tagged with the words: MNRAS in the JacketFlap blog reader. What is a tag? Think of a tag as a keyword or category label. Tags can both help you find posts on JacketFlap.com as well as provide an easy way for you to "remember" and classify posts for later recall. Try adding a tag yourself by clicking "Add a tag" below a post's header. Scroll down through the list of Recent Posts in the left column and click on a post title that sounds interesting. You can view all posts from a specific blog by clicking the Blog name in the right column, or you can click a 'More Posts from this Blog' link in any individual post.
The Big Bang theory predicts that there was a powerful repulsive force at the beginning of the expanding of the Universe. A common hypothesis of the cause of the Big Bang is a short-term repulsive field, the so-called “inflanton”. Observations of supernovas have shown that the Universe is still expanding with acceleration.
What was our solar system composed of right after its formation? Using sophisticated computer simulations, researchers from France and Australia have obtained new insights into the chemical composition of the dust grains that formed in the early solar system which went on to form the building blocks of the terrestrial planets.
Quasars are distant galactic nuclei generating spectacular amounts of energy by matter accretion onto their central supermassive black holes. The precise geometry and origin of this huge activity are still largely unknown, and direct spatial resolution of the emitting regions from such distant monsters is not currently possible.
A galaxy is a gigantic system possessing billions of stars, vast amounts of gas, dust and dark matter held together by gravitational attraction. Typical size of galaxies can be anywhere from a few tens-of-thousands to a few hundreds-of-thousands of light-years.
The alignment of both the Sun and the Earth with another planet in the Solar System is a rare event, which we are seldom able to observe in a lifetime.
Many of you have likely seen the beautiful grand spiral galaxies captured by the likes of the Hubble space telescope. Images such as those below of the Pinwheel and Whirlpool galaxies display long striking spiral arms that wind into their centres. These huge bodies represent a collection of many billions of stars rotating around the centre at hundreds of kilometers per second. Also contained within is a tremendous amount of gas and dust, not much different from that found here on Earth, seen as dark patches on the otherwise bright galactic disc.
Pinwheel and whirlpool spiral galaxies, a.k.a. M101 and M51:
Yet, rather embarrassingly, whilst we have many remarkable images of a veritable zoo of galaxies from across the Universe, we have surprisingly little knowledge of the appearance and structure of our own galaxy (the Milky Way). We do not know with certainty for example how many spiral arms there are. Does it have two, four, or no clear structure? Is there an inner bar (a long thin concentration of stars and gas), and if so does it rotate with the arms, or faster than them? Unfortunately we cannot simply take a picture from outside the galaxy as we can with those above, even if we could travel at the speed of light it would take tens of thousands of years to get far away enough to get a good picture!
The main difficulty comes from that we are located inside the disc of our galaxy. Just as we cannot know what the exterior of a building looks like if we are stuck inside it, we cannot get a good picture of what our own galaxy looks like from the Earth’s position. To build a map of our galaxy we rely on measuring the speeds of stars and gas, which we then convert to distances by making some assumptions of the structure. However the uncertainty in these distances is high, and despite a multitude of measurements we have no resounding consensus on the exact shape of our galaxy.
Movie showing how spiral arms (left) appear in velocity space (right).
There is, however, a way around this problem. Instead of trying to calculate distances, we can simply look at the speed of the observed material in the galaxy. The movie above shows the underlying concept. By measuring the speed of material along the line of sight from where the Earth is located in the galaxy, you built up a pseudo-map of the structure. In this example the grey disc is the structure you would see if the galaxy were a featureless disc. If we then superimpose some arm features, where the amount of stars and gas is greater than that in the rest of the galaxy, we see the arms clearly appear in our velocity map. Maps of this kind exist for our galaxy, with those for hydrogen and carbon monoxide (shown below) gas displaying the best arm features.
This may appear the problem is solved; we can simply trace the arm features and map them back onto a top-down map. Unfortunately doing so introduces the problems as measuring distances in the first place, and there is no single solution for mapping material from velocity to position space.
A different approach is to try and reproduce the map shown above by making informed estimates of what we believe the galaxy may look like. If we choose some top-down structure that re-creates the velocity map shown above, that we have observed directly from here on Earth, then we can assume the top-down map is also a reasonable map of the Milky Way.
Our work then began on a large number of simulations investigating the many different possibilities for the shape of the galaxy, investigating such parameters as the number of arms and speed of the bar. Care had to be taken with creating the velocity map, as what is actually measured by observations is the emission of the gas (akin to temperature). This can be absorbed and re-emitted by any additional gas the emission may pass through en route to the Earth.
In the two videos below are our best-fitting maps found for a two armed and four-armed model. Two arms tend not to produce enough structure, while the four-armed models can reproduce many of the features. Unfortunately it is very difficult to match all the features at the same time. This suggests that the arms of the galaxy may be of some irregular shape, and are not well encompassed by some regular, symmetric spiral pattern. This still leaves the question somewhat open, but also informs us that we need to investigate more irregular shapes and perhaps more complex physical processes to finally build a perfect top-down map of our galaxy.
The cosmology community is abuzz with news from the BICEP2 experiment of the discovery of primordial gravitational waves, through their signature in the cosmic microwave background. If verified, this will be a clear indication that the very young universe underwent a period of acceleration, known as cosmic inflation. During this period, it is thought that the seeds were laid down for all the structures to form later in the universe, including galaxies, stars, and indeed ourselves.
The cosmic microwave background (CMB) is radiation left over from the Hot Big Bang, first discovered in 1965 and corresponding to a temperature only about 2.7 degrees above absolute zero. In 1992 the COBE satellite made the first detection of temperature variations in the CMB, and successive experiments, including satellite missions WMAP and Planck, have been accurately measuring these variations which have become the key tool to understanding our universe.
In addition to its brightness, radiation can have a polarisation, meaning that the electromagnetic oscillations that make up the light have a preferred orientation, e.g. horizontal or vertical. This same effect is used in 3D cinemas, where light of different polarisations reaches your left or right eye, the lenses in the glasses blocking out one or other from each eye. In the CMB the polarisation signal is very small, and moreover comes in two types, known as E-mode and B-mode polarisation. The second of these, corresponding to a twisting pattern of polarisation on the sky, is what BICEP2 has discovered for the first time. This twisting pattern is the signature of gravitational waves, created in the early universe and whose presence causes space-time itself to ‘wobble’ as the light from the CMB crosses the Universe.
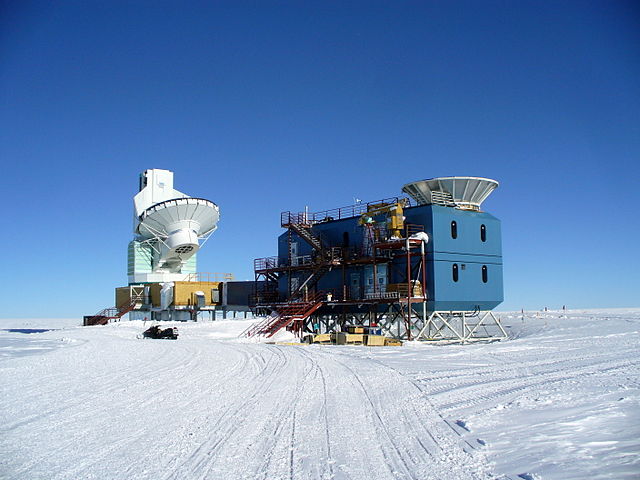
The Dark Sector Laboratory at Amundsen-Scott South Pole Station. At left is the South Pole Telescope. At right is the BICEP2 telescope. Photo by Amble, 2009. CC-BY-SA-3.0 via Wikimedia Commons.
The BICEP2 team have been working for several years with the single aim of measuring this signal; inflation predicted it to be there but said nothing about its strength. Based at the South Pole, where the unusually clear and dry air creates an ideal viewpoint for accurate measurement, three years of observations were carried out from 2010 to 2012. Their experiment differs from others measuring the CMB polarisation because they focussed on covering as large an area of the sky as possible, at relatively moderate angular resolution, in order to specifically target the B-mode signal.
While the discovery of gravitational waves had been widely rumoured in the days leading up to the announcement, including even the size of the measured signal, what took everyone’s breath away was the significance of the signal. At 6 to 7-sigma, it exceeds even the gold-standard 5-sigma used at CERN for the Higgs particle detection. Most would have expected something tentative, 2 or 3-sigma perhaps. We will want verification, of course, especially because the use of just a single wavelength of observation (the microwave equivalent of using just one colour of the rainbow) means the experiment is a little vulnerable to radiation from sources other than the CMB, such as intervening galaxies or emission caused by particles spiralling around our own Milky Way’s magnetic fields. The strength of the detection suggests that will not be an issue, but for sure we want to see independent confirmation by other experiments and at other wavelengths. Some may have announcements even before the end of the year, including the Planck satellite mission.
The response of the cosmology community to BICEP2 has been staggeringly swift. Early communication and discussion was already underway during the web-streamed BICEP2 press conference, via a Facebook discussion group set up by Scott Dodelson at Fermilab. The first science papers using the results were already appearing on arXiv.org database within the next couple of days (including theseones by me!). By the end of March, only two weeks after the announcement, there were already almost 50 available papers with ‘BICEP’ in the title, written by researchers all around the world. Papers on BICEP2 are clearly going to be a main theme for astronomy journals, including MNRAS, for the remainder of the year as we all try to figure out what, in detail, it all means.
Andrew Liddle is Professor of Theoretical Astrophysics at the Institute for Astronomy, University of Edinburgh. He is an editor of the OUP astronomy journal Monthly Notices of the Royal Astronomical Society.
Monthly Notices of the Royal Astronomical Society (MNRAS) is one of the world’s leading primary research journals in astronomy and astrophysics, as well as one of the longest established. It publishes the results of original research in astronomy and astrophysics, both observational and theoretical.
Subscribe to the OUPblog via email or RSS.
Subscribe to only physics and chemistry articles on the OUPblog via email or RSS.
On 11 September 2013, an unusually long and bright impact flash was observed on the Moon. Its peak luminosity was equivalent to a stellar magnitude of around 2.9.
What happened? A meteorite with a mass of around 400 kg hit the lunar surface at a speed of over 61,000 kilometres per hour.
Rocks often collide with the lunar surface at high speed (tens of thousands of kilometres per hour) and are instantaneously vaporised at the impact site. This gives rise to a thermal glow that can be detected by telescopes from Earth as short duration flashes. These flashes, in general, last just a fraction of a second.
The extraordinary flash in September was recorded from Spain by two telescopes operating in the framework of the Moon Impacts Detection and Analysis System (MIDAS). These devices were aimed to the same area in the night side of the Moon. With a duration of over eight seconds, this is the brightest and longest confirmed impact flash ever recorded on the Moon.
Our calculations show that the impact, which took place at 20:07 GMT, created a new crater with a diameter of around 40 meters in Mare Nubium. This rock had a size raging between 0.6 and 1.4 metres. The impact energy was equivalent to over 15 tons of TNT under the assumption of a luminous efficiency of 0.002 (the fraction of kinetic energy converted into visible radiation as a consequence of the hypervelocity impact).
The detection of impact flashes is one of the techniques suitable to analyze the flux of incoming bodies to the Earth. One of the characteristics of the lunar impacts monitoring technique is that it is not possible to unambiguously associate an impact flash with a given meteoroid stream. Nevertheless, our analysis shows that the most likely scenario is that the impactor had a sporadic origin (i.e., was not associated to any known meteoroid stream). From the analysis of this event we have learnt that that one metre-sized objects may strike our planet about ten times as often as previously thought.
Dr. Jose Maria Madiedo is a professor at Universidad de Huelva. He is the author of “A large lunar impact blast on 2013 September 11” in the most recent issue of the Monthly Notices of the Royal Astronomical Society.
Monthly Notices of the Royal Astronomical Society is one of the world’s leading primary research journals in astronomy and astrophysics, as well as one of the longest established. It publishes the results of original research in astronomy and astrophysics, both observational and theoretical.
Subscribe to the OUPblog via email or RSS.
Subscribe to only physics and chemistry articles on the OUPblog via email or RSS.