JacketFlap connects you to the work of more than 200,000 authors, illustrators, publishers and other creators of books for Children and Young Adults. The site is updated daily with information about every book, author, illustrator, and publisher in the children's / young adult book industry. Members include published authors and illustrators, librarians, agents, editors, publicists, booksellers, publishers and fans. Join now (it's free).
Login or Register for free to create your own customized page of blog posts from your favorite blogs. You can also add blogs by clicking the "Add to MyJacketFlap" links next to the blog name in each post.
Blog Posts by Tag
In the past 7 days
Blog Posts by Date
Click days in this calendar to see posts by day or month
Viewing: Blog Posts Tagged with: anime gallery, Most Recent at Top [Help]
Results 26 - 50 of 129
How to use this Page
You are viewing the most recent posts tagged with the words: anime gallery in the JacketFlap blog reader. What is a tag? Think of a tag as a keyword or category label. Tags can both help you find posts on JacketFlap.com as well as provide an easy way for you to "remember" and classify posts for later recall. Try adding a tag yourself by clicking "Add a tag" below a post's header. Scroll down through the list of Recent Posts in the left column and click on a post title that sounds interesting. You can view all posts from a specific blog by clicking the Blog name in the right column, or you can click a 'More Posts from this Blog' link in any individual post.
Jose Nuñez lives in a homeless shelter in Queens with his wife and two children. He remembers arriving at the shelter: ‘It’s literally like you are walking into prison. The kids have to take their shoes off, you have to remove your belt, you have to go through a metal detector. Even the kids do. We are not going into a prison, I don’t need to be stripped and searched. I’m with my family. I’m just trying to find a home’.
Maryann Broxton, a lone mother of two, finds life exhausting and made worse by ‘the consensus that, as a poor person, it is perfectly acceptable to be finger printed, photographed and drug-tested to prove that I am worthy of food. Hunger is not a crime. The parental guilt is punishment enough.’
Palma McLaughlin, a victim of domestic violence, notes that ‘now she is poor, she is stigmatised’; no longer ‘judged by her skills and accomplishments but by what she doesn’t have’.
People in poverty feel ashamed because they cannot afford to live up to social expectations. Being a good parent means feeding your children; being a good relative means exchanging gifts at celebrations. Friendships need to be sustained by buying a round of drinks or returning money that has been borrowed. When you cannot afford to do these things, your sense of shame is magnified by others. Friends, even close relatives, avoid you. Your children despise you, asking, for example: ‘why was I born into this family?’. Society similarly accuses you of being lazy, abusing drugs or promiscuity, assumed guilty until proved innocent. You can even be blamed for the ills of your country, the high levels of crime or its relative economic decline. The middle class in Uganda ask: ‘how can Uganda be poor when the soils are rich and the climate is good if it’s not the fault of subsistence farmers’?’
In the US, as in Britain, it may be welfare expenditure that is blamed for stifling productive investment.
Beggar’s sign, by Gamma Man. CC-BY-2.0 via Flickr.
Shame is debilitating as well as painful. People avoid it by attempting to keep up appearances, pretending everything is fine. In so doing, they often live in fear of being found out and risk overextending finances and incurring bad debts. People in poverty typically avoid social situations where they risk being exposed to shame; in so doing lose the contacts that might help them out when times get particularly harsh. Sometimes shame drives people into clinical depression, to substance abuse and even to suicide. Shame saps self-esteem, erodes social capital and diminishes personal efficacy raising the possibility that it serves also to perpetuate poverty by reducing individuals’ ability to help themselves.
Shame also divides society. While the stigma attaching to policies can be unintentional, sometimes the result of underfunding and staff working under pressure, the public rhetoric of deserving and undeserving exacerbates misunderstanding between rich and poor, nurturing the presumption that the latter are invariably inadequate or dishonest. Often around the world, stigmatising welfare recipients is deliberate and frequently supported by popular opinion. Blaming and shaming are commonly thought to be effective ways of policing access to welfare benefits and regulating anti-social and self-destructive behaviour. However, such beliefs are based on two assumptions that are untenable. The first is that poverty is overwhelmingly of people’s own making, the result of individual inadequacy. This can hardly be the case in Uganda, Pakistan or India. Nor is so elsewhere. Poverty is for the most part structural, caused by factors beyond individual control relating to the workings of the economy, the mix of factors of production and the outcome of primary and secondary resource allocation. The second assumption is that shaming people changes their behaviour enabling them to lift themselves out of poverty. However, the scientific evidence overwhelmingly demonstrates that shaming does not facilitate behavioural change but merely imposes further pain.
Jose, Maryann and Palma were not participants in a research project. Rather they are members of ATD Fourth World, an organisation devoted to giving people in poverty voice, and their testimonials are available to read online. Echoing Martin Luther King, Palma dreams that one day her four children will be judged not by the money in their bank accounts but by the quality of their character.
Headline image credit: ‘Someone Special to Someone, Sometime’ by John W. Iwanski. CC BY-NC 2.0 via Flickr.
For investors and asset managers, expected stock returns are the rates of return over a period of time in the future that they require to earn in exchange for holding the stocks today. Expected returns are a central input in their decision process of allocating wealth across stocks, and are essential in determining their welfare. For corporate managers, expected returns on the stocks of their companies, or the costs of equity, are the rates of returns over a period of time in the future that their shareholders require to earn in exchange for injecting equity to their companies today. The costs of equity play a key role in the decision process of corporate managers when deciding which investment projects to take and how to finance the investment. Despite the paramount importance, no consensus exists on how to best estimate expected stock returns. In fact, one of the most important challenges in academic finance is to explain anomalies, empirical patterns of expected stock returns that seem to evade traditional theories.
A manager should optimally keep investing until the investment costs today equal the value of future investment benefits discounted to today’s dollar terms, using her firm’s expected stock return as the discount rate. This economic logic implies that all else equal, stocks of firms with high investment should have lower discount rates than stocks with low investment. Intuitively, low discount rates lead to high discounted values of new projects and high investment. In addition, stocks with high profitability (investment benefits) relative to low investment should have higher discount rates than stocks with low profitability. Intuitively, the high discount rates are necessary to offset the high profitability to induce low discounted values for new projects and low investment.
Forex stock exchanges, by Allan Ajifo. CC-BY-2.0 via Wikimedia Commons.
To implement this idea, we use a standard technique in academic finance that “explains” a stock’s return with the contemporaneous returns on a number of factors. In a highly influential study, Fama and French (1993) specify three factors: the return spread between the overall stock market and the one-month Treasury bill, the return spread between small market cap and big market cap stocks, and the return spread between stocks with high accounting relative to market value of equity and stocks with low accounting relative to market value of equity. Carhart (1997) forms a four-factor model by augmenting the Fama-French model with the return spread between stocks with high prior six to twelve month returns and stocks with low prior six to twelve month returns.
We propose a new four-factor model, dubbed the q-factor model, which includes the market factor, a size factor, an investment factor, and a profitability factor. The market and size (market cap) factors are basically the same as before. The investment factor is the return spread between stocks with low investment and stocks with high investment. The profitability factor is the return spread between stocks with high profitability and stocks with low profitability. The q-factor model captures most of the anomalies that prove challenging for the Fama-French and Carhart models in the data.
Specifically, during the period from January 1972 to December 2012, the investment factor earns an average return of 0.45% per month, and the profitability factor earns 0.58%. The Fama-French and Carhart models cannot capture our factor returns, but the q-factor model can capture the returns on the Fama-French and Carhart factors. More important, the q-factor model outperforms the Fama-French and Carhart models in “explaining” a comprehensive set of 35 significant anomalies in the US stock returns. The average magnitude of the unexplained returns is on average 0.20% per month in the q-factor model, which is lower than 0.55% in the Fama-French model and 0.33% in the Carhart model. The number of unexplained anomalies is 5 in the q-factor model, which is lower than 27 in the Fama-French model and 19 in the Carhart model. The q-factor model’s performance, combined with its economic intuition, suggests that it can serve as a new benchmark for estimating expected stock returns.
The construction or recertification of a nuclear power plant often draws considerable attention from activists concerned about safety. However, nuclear powered US Navy (USN) ships routinely dock in the most heavily populated areas without creating any controversy at all. How has the USN managed to maintain such an impressive safety record?
The USN is not alone, many organizations, such as nuclear public utilities, confront the need to maintain perfect reliability or face catastrophe. However, this compelling need to be reliable does not insulate them from the need to innovate and change. Given the high stakes and the risks that changes in one part of an organization’s system will have consequences for others, how can such organizations make better decisions regarding innovation? The experience of the USN is apt here as well.
Given that they have at their core a nuclear reactor, navy submarines are clearly high-risk organizations that need to innovate yet must maintain 100% reliability. Shaped by the disastrous loss of the USS Thresher in 1963 the U.S. Navy (USN) adopted a very cautious approach dominated by safety considerations. In contrast, the Soviet Navy, mindful of its inferior naval position relative to the United States and her allies, adopted a much more aggressive approach focused on pushing the limits of what its submarines could do.
Decision-making in both organizations was complex and very different. It was a complex interaction among individuals confronting a central problem (their opponents’ capabilities) with a wide range of solutions. In addition, the solution was arrived at through a negotiated political process in response to another party that was, ironically, never directly addressed, i.e. the submarines never fought the opponent.
Perhaps ironically, given its government’s reputation for rigidity, it was the Soviet Navy that was far more entrepreneurial and innovative. The Soviets often decided to develop multiple types of different attack submarines – submarines armed with scores of guided missiles to attack U.S. carrier battle groups, referred to as SSGNs, and smaller submarines designed to attack other submarines. In contrast the USN adopted a much more conservative approach, choosing to modify its designs slightly such as by adding vertical launch tubes to its Los Angeles class submarines. It helped the USN that it needed its submarines to mostly do one thing – attack enemy submarines – while the Soviets needed their submarines to both attack submarines and USN carrier groups.
The Hunt for Red October, Soviet Submarine – 1970s, by Kevin Labianco. CC-BY-NC-ND-2.0 via Flickr.
As a result of their innovation, aided by utilizing design bureaus, something that does not exist in the U.S. military-industry complex, the Soviets made great strides in closing the performance gaps with the USN. Their Alfa class submarines were very fast and deep diving. Their final class of submarine before the disintegration of the Soviet Union – the Akula class – was largely a match for the Los Angeles class boats of the USN. However, they did so at a high price.
Soviet submarines suffered from many accidents, including ones involving their nuclear reactor. Both their SSGNs, designed to attack USN carrier groups, as well as their attack submarines, had many problems. After 1963 the Soviets had at least 15 major accidents that resulted in a total loss of the boat or major damage to its nuclear reactor. One submarine, the K429 actually sunk twice. The innovative Alfas, immortalized in The Hunt for Red October, were so trouble-prone that they were all decommissioned in 1990 save for one that had its innovative reactor replaced with a conventional one. In contrast, the USN had no accidents, though one submarine, the USS Scorpion, was lost in 1968 to unknown causes.
Why were the USN submarines so much more reliable? There were four basic reasons. First, the U.S. system allowed for much more open communication among the relevant actors. This allowed for easier mutual adjustment between the complex yet tightly integrated systems. Second, the U.S. system diffused power much more than in the Soviet political system. As a result, the U.S. pursued less radical innovations. Third, in the U.S. system decision makers often worked with more than one group – for example a U.S. admiral not only worked within the Navy, but also interacted with the shipyards and with Congress. Finally, Admiral Rickover was a strong safety advocate who instilled a strong safety culture that has endured to this day.
In short, share information, share power, make sure you know what you are doing and have someone powerful who is an advocate for safety. Like so much in management it sounds like common sense if you explain it well, but in reality it is very hard to do, as the Soviets discovered.
Feature image credit: Submarine, by subadei. CC-BY-2.0 via Flickr.
In 2007, the UK Parliament passed the Legal Services Act (LSA), with the goal of liberalizing the market for legal services in England and Wales and encouraging more competition—in response to the governmentally commissioned ‘Clementi’ report finding the British legal market opaque, inflexible, overly complex, and insulated from innovation and competition.
Among other salient provisions, the LSA authorized the creation of ‘Alternative Business Structures,’ permitting non-lawyers to take managerial, professional, and ownership roles, and explicitly opening the door to law firms raising capital from outside investors and combining with other professional services firms—even listing publicly on a stock exchange. All this has made the UK’s £25-billion/year legal marketplace “one of the most liberalized in the world,” according to the Financial Times.
Gavel and scales of justice, by pennstatenews. CC BY-NC-ND-2.0 via Flickr.
Our question for today is whether this bracing demolition of guild-like protectionist rules will stop at the English coastline—more specifically, whether it will leap the North Atlantic to the US, the single largest legal marketplace in the world by far, now just north of $250-billion (£150-billion) per year. It would be the irresistible force meeting the immovable object.
Two predictions may be made without fear of contradiction.
First is that the American Bar Association (ABA), with its 400,000 members, will resist any incursions into US lawyers’ monopoly over legal services with every weapon at their disposal short of, perhaps, violence. A core function of the ABA is promulgating the “Model Rules of Professional Conduct,” which have the force of law in 49 states. ABS’s would flatly offend Rule 5.4(a), prohibiting fee-sharing with a non-lawyer, and 5.4(d), prohibiting practicing in any organization where a non-lawyer owns an interest.
We know ABA opposition will be fierce because it happened once before. In 2000, the ABA’s governing House of Delegates entertained a proposal to amend the ethical rules to permit “multidisciplinary practices” (consider them the functional equivalent of the UK’s ABS’s). This went down to “crushing defeat” as the state bars of Illinois, New Jersey, New York, Florida, and Ohio joined in “strident” denunciation of the heresy of fee sharing and vehement “reaffirmation of the core values of the law of lawyering.”
The horrified opposition cited fears of the invasion of the profession by predatory investors prepared to sacrifice clients on the altar of profits. Adam Smith – or for that matter Peter Drucker – might be skeptical of the long-run viability of a business premised on putting its clients last, but be that as it may, I’m reminded of the remark by American Lawyer editor-in-chief Aric Press some years ago that the magazine’s creation of the notorious profits-per-partner scorecard for law firms “did not introduce the profession to greed.”
Lest you believe the world might have moved on in the intervening decade and a half, and that we have learned guilds tend to collapse of their own sclerosis by now, permit me to disabuse you of that hope. Earlier this year the state bar of Texas issued a binding opinion that law firms there may not include the terms “officer” or “principal” in the job title of non-lawyer employees. “Don’t mess with Texas,” indeed.
Finally, note that the states leading the charge here are six of the ten largest in the US, comprising nearly one-third of the country’s total population. Their opposition will not be trifling: They have ground troops.
My second prediction: A barrier which will effectively halt the flow of money and ideas at any essentially arbitrary line—such as a national border—has yet to be invented. If you doubt this, I refer you to the extended and unblemished track record of abject failure in US attempts to control or limit political campaign financing.
If globalization stands for anything, it is the accelerating movement of capital, people, and ideas across jurisdictional borders – movement which, despite hiccups and speed bumps, is becoming steadily more frictionless and irreversible. In the case of Law Land, this would mean a UK-based ABS coming to our shores (and I devoutly hope their beach-head would be little old New York – I want a front-row seat to this brawl) with a checkbook and an appetite for expansion.
The moment the announcement is made, I predict that two inter-related dynamics would begin playing themselves out.
First, managing partners of US-based firms would go through the famous stages of grief: denial, anger, bargaining, depression, and ultimately acceptance. Acceptance here could only translate into a demand for a “level playing field” for their firms. Since, then as now, they presumably will lack the votes in Parliament to repeal the LSA, that would mean adopting a functional equivalent – permitting MDP’s – here in the US. And a level playing field is, after all, a bedrock imperative of fairness. They would be making a nice argument.
Second, someone would sue. It matters not whether it be the ABS suing for permission or an aggrieved US lawyer suing for prohibition; a “real case or controversy” would be presented for adjudication. I’m not going to practice antitrust or constitutional law in these pages, but my strong intuition is that a challenge to the bar prohibitions on non-lawyer involvement would prevail on a combination of antitrust and commerce clause claims (the “commerce clause,” Article I, §8.3 of the US Constitution, prohibits unduly burdensome state interference with interstate commerce, and since at least the era of the New Deal it has been given extraordinarily wide reach).
But the outcome really shouldn’t be determined by tidy legalities. At root, it should come down to a socioeconomic and ethical choice driven by which of these views of the legal profession is on the right side of history.
Do we prefer the cozy walled precincts of the guild, righteously defending its economic rents under the cloak of claims of “the best interest of the client,” “confidentiality,” “privilege,” and so forth? Or do we prefer Schumpeter’s, or Silicon Valley’s, bracing call for “creative destruction,” as messy and fraught with failed experiments as we can be sure it will be?
I certainly know where my heart lies, and it’s with the best interests of the client truly and rightly understood. Unleash the market’s Darwinian selection process.
For those addicted to politics, newspapers and magazines have long provided abundant, sometimes even insightful coverage. During the last hundred years, print outlets have been supplemented by radio, then television, then 24/7 cable TV news. And with the growth of the internet, consumers of political news now have access to more analysis than ever.
One analytical tool that the politics-following public will not have access to this year is Intrade, an on-line political prediction market. Political prediction markets work very much like financial markets. Investors “buy” a futures contract on a particular candidate; if that candidate wins, the contract pays a set amount (typically $1); if the candidate loses, the contract becomes worthless. The price of candidates’ contracts vary between zero and $1, rising and falling with their political fortunes—and their probability of winning. You can see a graph of Obama and Romney contracts in the months preceding the 2012 election here.
Organized political betting markets have existed in the United States since the early days of the Republic. According to a 2003 paper by Rhode and Strumpf, during the late 19th and early 20th centuries wagering on political outcomes was common and market prices of contracts were often published in newspapers along with those of more conventional financial investments. Rhode and Strumpf note that at the Curb Exchange in New York, the total sum placed on political contracts sometimes exceeded trading in stocks and bonds.
Political betting markets became less popular around 1940. Betting on election outcomes no doubt continued to take place, but it was a much less high-profile affair.
Modern political prediction markets emerged with the establishment in 1988 of the Iowa Electronic Markets (IEM), a not-for-profit small-scale exchange run by the College of Business at the University of Iowa. The IEM was created as a teaching and research tool to both better understand how markets interpret real-world events and to study individual trading behavior in a laboratory setting. The IEM usually offers only a few contracts at any one time and investors are allowed to invest a relatively small amount of money. As of mid-October, the Iowa markets—like the polls more generally—were predicting that the Republicans will gain seats in the House and gain control of the Senate.
Wooden Ballot Box, by the Smithsonian Institution. Public domain via Wikimedia Commons.
An important feature of political prediction markets—like financial markets—is that they are efficient at processing information: the prices generated in those markets are a distillation of the collective wisdom of market participants. A desire to harness the market’s ability to process information led to an abortive attempt by the Defense Advanced Research Projects Agency in 2003 to create the Policy Analysis Market, which would allow individuals to bet on the likelihood of political and military events—including assassinations and terrorist attacks–taking place in the Middle East. The idea was that by processing information from a variety disparate sources, monitoring the prices of various contracts would help the defense establishment identify hot-spots before they became hot. The project was hastily cancelled after Congress and the public expressed outrage that the government was planning to provide the means (and motive) to speculate on—and possibly profit from–terrorism.
Another, longer-lived—and for a time, quite popular–prediction market was Intrade.com. This Dublin-based company was established in 1999. At first, it specialized in sports betting, but soon expanded to include an extensive menu of political markets. During recent elections, Intrade operated prediction markets on the presidential election outcome at the national level, the contest for each state’s electoral votes, individual Senate races, as well as a number of other political races in the US and overseas. Thus, Intrade offered a far variety of betting options than the IEM.
Intrade was forced to close last year when the US Commodities Futures Trading Commission (CFTC) filed suit against it for illegally allowing Americans to trade options (by contract, the IEM secured written opinions in 1992 and 1993 from the CFTC that it would not take action against IEM, because of that market’s non-profit, educational nature). The CFTS’s threat to Intrade’s largest customer base very quickly led to a dramatic drop-off in visitors to the site, which subsequently closed. Alternative off-shore betting markets have entered the political markets (e.g., Betfair), but their offerings pale by comparison with those formerly offered by Intrade and are probably too small at present to spur the CFTC to action.
I regret the loss of Intrade, but not because I used their services—I didn’t. Given the federal government’s generally hostile view toward internet gambling, I felt it was prudent to abstain. Plus, having placed a two-pound wager on a Parliamentary election with a bookmaker when I lived in England many years ago convinced me that an inclination to bet with the heart, rather than the head, makes for an unsuccessful gambler.
No, I miss Intrade because it provided a nice summary of many different political campaigns. Sure, there are plenty of on-line tools today that provide a wide array of expert opinion and sophisticated polling data. Still, as an economist, I enjoyed the application of the mechanisms usually associated with financial markets to politics and observing how political news generated fluctuations in those markets. No other single source today does that for as many political races as Intrade did.
Feature image credit: Stock market board, by Katrina.Tuiliao. CC-BY-2.0 via Wikimedia Commons.
While food insecurity in America is by no means a new problem, it has been made worse by the Great Recession. And, despite the end of the Great Recession, food insecurity rates remain high. Currently, about 49 million people in the U.S. are living in food insecure households. In a recently-released article in Applied Economics Policy and Perspectives my co-authors, Elaine Waxman and Emily Engelhard, and I provide an overview of Map the Meal Gap, a tool that is used to establish food insecurity rates at the local level for Feeding America (the umbrella organization for food banks in the United States).
For 35 years, Feeding America has responded to the hunger crisis in America by providing food to people in need through a nationwide network of food banks. Today, Feeding America is the nation’s largest domestic hunger-relief organization—a powerful and efficient network of 200 food banks across the country. You can learn more about food insecurity rates in America by listening to the below podcast:
What are the state-level determinants of food insecurity? What is the distribution of food insecurity across counties in the United States? How do the county-level food insecurity estimates generated in Map the Meal Gap compare with other sources? Along with reviewing Map the Meal Gap and finding out the answers to these questions, we discuss ways that policies can and are being used to reduce food insecurity in the United States.
Headline image credit: Supermarket trolleys, by Rd. Vortex. CC-BY-2.0 via Flickr.
Organizing and organizations have largely been seen as spatial constructs. Organizing has been seen as the connecting of individuals and technologies through various mechanisms, whereas organizations have been construed as semi-stable entities circumscribed by boundaries that separate them from their external environments. The spatial view enables us to appreciate the difference between Microsoft and Apple, between Manchester United and Liverpool, between a family and a firm, and between the government of Iraq and the government of France, as they are made up of different actors, exhibit different patterns of actions, pursue different strategies, and relate to different external stakeholders.
A spatial view is a powerful one, mainly by enabling correspondence. By looking at the pattern of the way that Manchester United plays their matches during a certain period of time, the team can be distinguished from its rivals. It also enables analysis of how it plays differently from how it has played during earlier times, which again may be held up against the results of the matches. When a certain team formation appears successful, it becomes associated with the wins and ascribed the manager who implemented the formation. The manager is then seen as the person who had the ability to conceive and implement the formation, which confers particular qualities upon him. Those qualities prevail until the results begin to degrade, in which case alternative ways are found to explain the limitations of the formation, as well the manager’s abilities to make it work. In order for this way of making sense, a line of separation is drawn between the manager and the team in order to make for a correspondence that explains the variation in results over time. The overall picture becomes a mosaic numerous little pieces, neatly arranged, make up a plausible story of wins and defeats. Although the overall picture may change, the pieces remain small self-contained pieces.
Wayne Rooney, by cortexena13. CC-BY-NC-SA-2.0 via Flickr.
When they are moved around to make another picture, the new formation is seen as different and distinct from the previous one. It is seen at a different instant, and the state in which it is seen as assumed to prevail as a sort of averaged out state for the duration of the period associated with that state. The change is the difference between the images. To see a changing thing at two different instants and making the inferences based on the differences between the instants is what the French philosopher Henry Bergson referred to as a series of immobilities. What is seen is a succession of images, where each image represents a static situation. A problem with such a view is that it is an incomplete rendering of what actually takes place, because it tells little or nothing about actual movement that takes place. As Bergson pointed out, what characterizes movement is precisely that it cannot be divided into imaginary stops, because it is indivisible. On the contrary, it leaves us with what Alfred North Whitehead called ‘simple location’. Simple location conveys an image of a process consisting of inert matter moved along in a series of mysterious jumps. We see that the mosaic has changed, but we know nothing about the process of changing it.
Yet, organizing is a vibrant process in which each instant plays a role. It is an infinitely complex world of encounters, instants and events, all taking place in time. To better understand how organizing works as a process, the very notion of time needs to be given its due attention. Unfortunately, although time and space have been seen as constituting an interwoven continuum in physics for nearly a century, in the social sciences they have been kept apart in a sort of Newtonian conception of the world. A process orientation to time, on the other hand, treats time as the very essences from which experience is made. Rather than being seen as a Newtonian inert framework against which movement is measured, time takes the role of mattering. Time matters, not just in the sense of being important, but by shaping the matter at hand, such as football players, teams, and leagues.
It is in the flow of time that organisations carve out their temporal existence. It is this ‘carving out’ that provides them with a temporal sense of where they come from and where that may be heading. The ‘carving out’ is done in a state of constant suspension between past and future, and is enacted at many instants. Streams of acts, decisions, emails, tweets, chats and many other types instants make up the temporal mosaic of the organization and contribute towards its becoming in time. Thus the formation of the football team is not a static entity, but a living process of instantiations as the match is played. In this view the formation does not make the acts, but the acts make the formation. Such a view does not deny formation as a spatial image. During a match a specific formation may be pursued. What it does, is explain the work of sustaining the formation. It explains how the formation, rather than just existing as an inert template, is given life. It confers temporal direction upon the formation and invites questions about its past and possible future, in the moment it is being played out.
Headline image credit: Stocks Reservoir, Forest of Bowland. Panoramic by MatthewSavage.Photography. CC-By-2.0 via Flickr.
The business press and general media often lament that firm executives are exhibiting “short-termism”, succumbing to the pressure by stock market investors to maximize quarterly earnings while sacrificing long-term investments and innovation. In our new article in the Socio-Economic Review, we suggest that this complaint is partly accurate, but partly not.
What seems accurate is that the maximization of short-term earnings by firms and their executives has become somewhat more prevalent in recent years, and that some of the roots of this phenomenon lead to stock market investors. What is inaccurate, though, is the assumption that investors – even if they were “short-term traders” – would inherently attend to short-term quarterly earnings when making trading decisions. Namely, even “short-term trading” (i.e. buying stocks with the aim to sell them after few minutes, days, or months) does not equal or necessitate “short-term earnings focus”, i.e., making trading decisions based on short-term earnings (let alone based on short-term earnings only). This means that in case the media observes – or executives perceive – that firms are pressured by stock market investors to focus on short-term earnings, such a pressure is illusionary, in part.
The illusion, in turn, is based on the phenomenon of “vociferous minority”: a minority of stock investors may be focusing on short-term earnings, causing some weak correlation between short-term earnings and stock price jumps / drops. But the illusion is born when this gets interpreted as if most or all investors (i.e., the majority) would be focusing on short-term earnings only. Alas, such an interpretation may, in the dynamic markets, lead to a self-fulfilling prophecy – whereby an increasing number of investors join the vociferous minority and focus increasingly on short-term earnings (even if still not the majority of investors would focus on short-term earnings only). And more importantly – or more unfortunately – firm executives may start to increasingly maximize short-term earnings, too, due to the (inaccurate) illusion that the majority of investors would prefer that.
Rolls Royce, by Christophe Verdier. CC-BY-2.0 vis Flickr.
A final paradox is the role of the media. Of course, the media have good intentions in lamenting about short-termism in the markets, trying to draw attention to an unsatisfactory state of affairs. However, such lamenting stories may actually contribute to the emergence of the self-fulfilling prophecy. Namely, despite the lamenting tone of the media articles, they are in any case emphasizing that the market participants are focusing just on short-term earnings. This contributes to the illusion that all investors are focusing on short-term earnings only – which in turn may lead a bigger majority of investors and firms to actually join the minority’s bandwagon, in the illusion that everyone else is doing that too.
Should the media do something different, then? Well, we suggest that in this case, the media should report more on “positive stories”, or cases whereby firms have managed to create great innovations with a patient, longer-term focus. The media could also report on an increasing number of investors looking at alternative, long-term measures (such as patents or innovation rates) instead of short-term earnings.
So, more stories like this one about Rolls-Royce – however, without claiming or lamenting that most investors are just wanting “quick results” (i.e., without portraying cases like Rolls-Royce just as rare exceptions). Such positive stories could, in the best scenario, contribute to a reverse, self-fulfilling prophecy – whereby more and more investors, and thereafter firm executives, would replace some of the excessive focus on short-term earnings that they might currently have.
Political economy is back on the centre stage of development studies. The ultimate test of its respectability is that the World Bank has realised that it is not possible to separate social and political issues such as corruption and democracy from other factors that influence the effectiveness of its investments, and started using the concept.
It predates the creation of “economics” as a discipline. Adam Smith, David Ricardo, Thomas Malthus, James Mill, and a generation later Karl Marx and Friederich Engels, explored how groups or classes in society exploited each other or were exploited, and used their conclusions to create theories of change or growth.
Marx’s ideas were taken up in the 1950s by economists and sociologists of the left, such as Paul Baran (The Political Economy of Growth, 1957) and later Samir Amin (The Political Economy of the Twentieth Century, 2000) who linked it to theories of imperialism and neo-colonialism to interpret what was happening in newly independent African countries where nationalist political parties had taken power.
Marx and Engels in their early writings, and Marxist orthodoxy subsequently, espoused determinist theories in which development went through pre-determined stages – primitive forms of social organisation, feudalism, capitalism, and then socialism. But in their later writings Marx and Engels were much more open, and recognised that some pre-capitalist formations could survive, and that there was no single road to socialism. Class analysis, and exploration of the economic interests of powerful classes, and their uses of the technologies available to them, could inform a study of history, but not substitute for it.
That was how I interpreted what happened in Tanzania in the 1970s. The country was built around the economic interests of those involved, and the mistakes made, both inside Tanzania but also outside. It focussed on the choices made by those who controlled the Tanzanian state or negotiated “foreign aid” deals with Western governments—Issa Shivji’s bureaucratic bourgeoisie. These themes are still current today.
Returning home after a day’s work, by Martapiqs. CC-BY-SA-2.0 via Flickr.
I am not alone. Michael Lofchie’s (A Political Economy of Tanzania, 2014) focuses on the difficult years of structural adjustment in the 1980s and 1990s). He argues how the salaried elite could personally benefit from an overvalued exchange rate. From 1979 on, under the influence of the charismatic President Julius Nyerere, Tanzania resisted the IMF and World Bank which urged it to devalue. But eventually, around the mid-1980s, they realised that they had the possibility of making even bigger financial gains if the country devalued and there were open markets, which would allow them to make money from trade or production. They were becoming a productive bourgeoisie.
Lofchie’s analysis can be contested. The benefits of the chaos that resulted from the extremely over-valued exchange rates of the 1980s were reaped by only a few. It is true that rapid growth followed from around 1990 to the present, but that is also due to the high price of gold on international markets and the rapid expansion of gold mining and tourism. There is still plenty of evidence of individuals making money illegitimately – corruption is ever present in the political discourse, and will continue to be so up till the Presidential elections due in October 2015.
A challenge for the ruling class in Tanzania, leaving the 1970’s, was would they be able to convert their economic strategies into meaningful growth and benefits for the population? By 2011 the challenge was even more acute, because very large reserves of gas had been discovered off the coast of Southern Tanzania, so money for investment would no longer be a binding constraint. But would those resources be used to create real assets which would create the prerequisites for rapid expansions in manufacturing, services and especially agriculture? Or would they be frittered away through imports of non-productive machinery and infrastructure (such as the non-existent electricity generators purchased through the Richmond Project in 2006 in which several leading members of the ruling political party were implicated)? Or end up in Swiss bank accounts? The jury is very much still out. To achieve the current ambition of a rapid transition to a middle income country will require much greater understanding of engineering, agricultural science, and much better contracts than have been recently achieved – and more proactive responses to the challenges of corruption. It will need to take its own political economy seriously.
Headline image credit: Tanzania – Mikumi by Marc Veraart. CC-BY-2.0 via Flickr.
It is well known that obesity rates have been increasing around the Western world.
The American obesity prevalence was less than 20% in 1994. By 2010, the obesity prevalence was greater than 20% in all states and 12 states had an obesity prevalence of 30%. For American children aged 2 – 19, approximately 17% are obese in 2011-2012. In the UK, the rifeness of obesity was similar to the US numbers. Between 1993 and 2012, the commonness of obesity increased from 13.2% to 24.4% for men and for women from 16.4% to 25.1%. The obesity prevalence is around 18% for children aged 11-15 and 11% for children aged 2-10.
Policy makers, researchers, and the general public are concerned about this trend because obesity is linked to an increase likelihood of health conditions such as diabetes and heart disease, among others. The increase in the obesity prevalence among children is of concern because of the possibility that obesity during childhood will increase the likelihood of being obese as an adult thereby leading to even higher rates of these health conditions in the future.
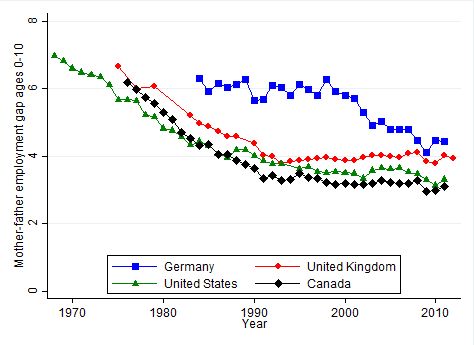
Researchers have investigated many possible causes for this trend including lower rates of participation in physical activity and easier access to fast food. Anderson, Butcher, and Levine (2003) identified maternal employment as a possible culprit when they noticed that in the US the timing of these two trends was similar. While the prevalence of obesity was increasing for children so was the employment rate of mothers. Other researchers have found similar results for other countries – more hours of maternal employment is related to a higher likelihood of children being obese.
What could be the relationship between a mother’s hours of work and childhood obesity? When mothers work they have less time to devote to activities around the home, which may mean less concern about nutrition, more meals eaten outside of the home or less time devoted to physical activities. On the other hand, more maternal employment could mean more income and an ability to purchase more nutritious food or encourage healthy activities for children.
Child playing with dreidels, by Dana Friedlander for Israel Photo Gallery. CC-BY-SA-2.0 via Flickr
We looked at this relationship for Canadian children 12-17 years old – an older group of children than studied in earlier papers. For youths aged 12 to 17 in Canada, the obesity prevalence was 7.8% in 2008. We analysed not only at the relationship between maternal employment and child obesity, but also the possible reasons that maternal employment may affect child obesity.
We find that the effect of hours of work differs from the effect of weeks of work. More hours of maternal work are related to activities we expect to be related to higher rates of obesity – more television viewing, less likely to eat breakfast daily, and a higher allowance. On the other hand, more weeks of maternal employment are related to behaviour expected to lower obesity – less television viewing and more physical activity. This difference between hours and weeks of work raises some interesting questions. How do families adapt to different aspects of the labour market? When mothers work for more weeks does this indicate a more regular attachment to the labour force? Do these families have schedules and routines that allow them to manage their child’s weight?
Unlike other studies that focus on younger children, we do not find a relationship between maternal employment and likelihood of obesity for adolescents. Does the impact of maternal employment at younger ages not last into adolescence? Is adolescence a stage during which obesity status is difficult to predict?
The debate over appropriate policy remedies should not focus on whether mothers should work, but rather should focus on what children are doing when mothers are working. What can be done to reduce the obesity prevalence in adolescents? Some ideas include working with the education system and local communities to create an environment for adolescents that fosters healthy weight status, supporting families with quality childcare, provision of viable and high-quality alternative activities, or flexible work hours. Programs or policies that help families establish a healthy routine are important. It may not be a case of simply providing activities for adolescents, but that these activities are easy for families to attend on a regular basis.
I havewrittenabout the dangers of making economic policy on the basis of ideology rather than cold, hard economic analysis. Ideologically-based economic policy has laid the groundwork for many of the worst economic disasters of the last 200 years.
The decision to abandon the first and second central banks in the United States in the early 19th century led to chronic financial instability for much of the next three quarters of a century.
Britain’s re-establishment of the gold standard in 1925, which encouraged other countries to do likewise, contributed to the spread and intensification of the Great Depression.
Europe’s decision to adopt the euro, despite the fact that economic theory and history suggested that it was a mistake, contributed to the European sovereign debt crisis.
President George W. Bush’s decision to cut taxes three times during his first term while embarking on substantial spending connected to the wars in Afghanistan and Iraq, was an important driver of the macroeconomic boom-bust cycle that led to the subprime crisis.
In each of these four cases, a policy was adopted for primarily ideological, rather than economic reasons. In each case, prominent thinkers and policy makers argued forcefully against adoption, but were ignored. In each case, the consequences of the policy were severe.
So how do we avoid excessively ideological economic policy?
One way is by making sure that policy-makers are exposed to a wide range of opinions during their deliberations. This method has been taken on board by a number central banks, where many important officials are either foreign-born or have considerable policy experience outside of their home institution and/or country. Mark Carney, a Canadian who formerly ran that that country’s central bank, is not the first non-British governor of the Bank of England in its 320-year history. Stanley Fischer, who was born in southern Africa and has been governor of the Bank of Israel, is now the vice chairman of the US Federal Reserve. The widely respected governor of the Central Bank of Ireland, Patrick Honohan, spent nearly a decade at the World Bank in Washington, DC. One of Honohan’s deputies is a Swede with experience at the Hong Kong Monetary Authority; the other is a Frenchman.
Money cut in pieces, by Tax Credits (TaxCredits.net). CC-BY-2.0 via Flickr.
But isn’t it unreasonable to expect politicians to come to the policy making process without any ideological bent whatsoever? After all, don’t citizens deserve to see a grand contest of ideas between those who propose higher taxes and greater public spending with those who argue for less of both?
In fact, we do expect—and want–our politicians to come to the table with differing views. Nonetheless, politicians often support their arguments with unfounded assertions that their policies will lead to widespread prosperity, while those of their adversaries will lead to doom. The public needs to be able to subject those competing claims to cold, hard economic analysis.
Fortunately, the United States and a growing number of other countries have established institutions that are mandated to provide high quality, professional, non-partisan economic analysis. Typically, these institutions are tasked with forecasting the budgetary effects of legislation, making it difficult for one side or the other to tout the economic benefits of their favorite policies without subjecting them to a reality check by a disinterested party.
In the United States, this job is undertaken by the Congressional Budget Office (CBO) which offers well-regarded forecasts of the budgetary effects of legislation under consideration by Congress. [Disclaimer: The current director of the CBO is a graduate school classmate of mine.]
The CBO is not always the most popular agency in Washington. When the CBO calculates that that the cost of a congressman’s pet project is excessive, that congressman can be counted on to take the agency to task in the most public manner possible.
According to the New York Times, the CBO’s “…analyses of the Clinton-era legislation were so unpopular among Democrats that [then-CBO Director Robert Reischauer] was referred to as the ‘skunk at the garden party.’ It has since become a budget office tradition for the new director to be presented with a stuffed toy skunk.”
For the most part, however, congressional leaders from both sides of the aisle hold the CBO and its work in high regard, as do observers of the economic scene from the government, academia, journalism, and the private sector.
These organizations each have their own institutional history and slightly different responsibilities. For the most part, however, they are constituted to be non-partisan, independent agencies of the legislative branch of government. We should be grateful for their existence.
Dystopias are trending in contemporary popular culture. Novels and movies abound that deal with fictional societies within which humans, individually and collectively, have to cope with repressive, technologically powerful states that do not usually care for the well-being or safety of their citizens, but instead focus on their control and extortion. The latest resounding dystopian success is The Hunger Games—a box-office hit located in a nation known as Panem, which consists of 12 poor districts, starved for resources, under the absolute control of a wealthy centre called the Capitol. In the story, competitive struggle is carried to its brutal extreme, as poor young adults in a reality TV show must fight to death in an outdoor arena controlled by an authoritarian Gamemaker, until only one individual remains. The poverty and starvation, combined with terror, create an atmosphere of fear and helplessness that pre-empts any resistance based on hope for a better world.
We fear that part of the popularity of this science fiction action-drama, in Europe at least, lies in the fact that it has a real-life analogue: the Spectacle—in Debord’s (1967) meaning of the term—of the current ‘competitiveness game’ in which the Eurozone economies are fighting for their survival. Its Gamemaker is the European Central Bank (ECB), which—completely stuck to Berlin’s hard line that fiscal profligacy in combination with rigid, over-regulated labour markets has created a deep crisis of labour cost competitiveness—has been keeping the pressure on Eurozone countries so as to let them pay for their alleged fiscal sins. The ECB insists that there will be ‘no gain without pain’ and that the more one is prepared to suffer, the more one is expected to prosper later on.
The contestants in the game are the Eurozone members—each one trying to bootstrap its economy out of the throes of the most severe crisis in living memory. The audience judging each country’s performance is not made up of reality TV watchers but of financial (bond) markets and credit rating agencies, whose supposedly rational views can make or break any economy. The name of the game is boosting cost-competitiveness and exports—and its rules are carved into stone in March 2011 in a Euro Plus ‘Competitiveness Pact’ (Gros, 2011).
The Hunger Games, by Kendra Miller. CC-BY-2.0 via Flickr.
Raising competitiveness here means reducing costs, and more specifically cutting labour costs, which means lowering the wage share by means of reducing employment protection, lowering minimum wages, raising retirement ages, lowering pensions and, last but not least, cutting real wages. Economic inequality, poverty and social exclusion will all initially increase, but don’t worry: structural reforms hurt in the beginning, but their negative effects will be offset over time by changes in ‘confidence,’ boosting spending and exports. But it will not work, and the damage done by austerity and structural reforms is enormous; sadly, most of it was and is avoidable. The wrong policies follow from ‘design faults’ built into the Euro project right from the start—the creation of an ‘independent’ European Central Bank being the biggest ‘fault’, as it precluded the necessary co-ordination of fiscal and monetary policy and disabled the central banking system from providing support to national governments (Arestis and Sawyer, 2011). But as Palma (2009) reminds us, it is wrong to think about these ‘faults’ as being caused by perpetual incompetence—the monetarist Euro project should instead be read as a purposeful ‘technology of power’ to transform capitalism into a rentiers’ paradise. This way, one can understand why policy makers persist in abandoning the unemployed.
Innovation is a primary driver of economic growth and of the rise in living standards, and a substantial body of research has been devoted to documenting the welfare benefits from it (an example being Trajtenberg’s 1989 study). Few areas have experienced more rapid innovation than the Personal Computers (PC) industry, with much of this progress being associated with a particular component, the Central Processing Unit (CPU). The past few decades had seen a consistent process of CPU innovation, in line with Moore’s Law: the observation that the number of transistors on an integrated circuit doubles every 18-24 months (see figure below). This remarkable innovation process has clearly benefitted society in many, profound ways.
“Transistor Count and Moore’s Law – 2011″ by Wgsimon – Own work. CC-BYSA-3.0 via Wikimedia Commons.
A notable feature of this innovation process is that a new PC is often considered “obsolete” within a very short period of time, leading to the rapid elimination of non-frontier products from the shelf. This happens despite the heterogeneity of PC consumers: while some (e.g., engineers or gamers) have a high willingness-to-pay for cutting edge PCs, many consumers perform only basic computing tasks, such as word processing and Web browsing, that require modest computing power. A PC that used to be on the shelf, say, three years ago, would still adequately perform such basic tasks today. The fact that such PCs are no longer available (except via a secondary market for used PCs which remains largely undeveloped) raises a natural question: is there something inefficient about the massive elimination of products that can still meet the needs of large masses of consumers?
Consider, for example, a consumer whose currently-owned, four-year old laptop PC must be replaced since it was severely damaged. Suppose that this consumer has modest computing-power needs, and would have been perfectly happy to keep using the old laptop, had it remained functional. This consumer cannot purchase the old model since it has long vanished from the shelf. Instead, she must purchase a new laptop model, and pay for much more computing power than she actually needs. Could it be, then, that some consumers are actually hurt by innovation?
A natural response to this concern might be that the elimination of older PC models from the shelves likely indicates that demand for them is low. After all, if we believe in markets, we may think that high levels of demand for something would provide ample incentives for firms to offer it. This intuition, however, is problematic: as shown in seminal theoretical work by Nobel Prize laureate Michael Spence, the set of products offered in an oligopoly equilibrium need not be efficient due to the misalignment of private and social incentives. The possibility that yesterday’s PCs vanish from the shelf “too fast” cannot, therefore, be ruled out by economic theory alone, motivating empirical research.
A recent article addresses this question by applying a retrospective analysis of the U.S. Home Personal Computer market during the years 2001-2004. Data analysis is used to explore the nature of consumers’ demand for PCs, and firms’ incentives to offer different types of products. Product obsolescence is found to be a real issue: the average household’s willingness-to-pay for a given PC model is estimated to drop by 257 $US as the model ages by one year. Nonetheless, substantial heterogeneity is detected: some consumers’ valuation of a PC drops at a much faster rate, while from the perspective of other consumers, PCs becomes “obsolete” at a much lower pace.
The paper focuses on a leading innovation: Intel’s introduction of its Pentium M® chip, widely considered as a landmark in mobile computing. This innovation is found to have crowded out laptops based on older Intel technologies, such as the Pentium III® and Pentium 4®. It is also found to have made a substantial contribution to the aggregate consumer surplus, boosting it by 3.2%- 6.3%.
These substantial aggregatebenefits were, however, far from being uniform across different consumer types: the bulk of the benefits were enjoyed by the 20% least price-sensitive households, while the benefits to the remaining 80% were small and sometimes negligible. The analysis also shows that the benefits from innovation could have “trickled down” to the masses of price-sensitive households, had the older laptop models been allowed to remain on the shelf, alongside the cutting-edge ones. This would have happened since the presence of the new models would have exerted a downward pressure on the prices of older models. In the market equilibrium, this channel is shut down, since the older laptops promptly disappear.
Importantly, while the analysis shows that some consumers benefit from innovation much more than others, no consumers were found to be actually hurt by it. Moreover, the elimination of the older laptops was not found to be inefficient: the social benefits from keeping such laptops on the shelf would have been largely offset by fixed supplier costs.
So what do we make of this analysis? The main takeaway is that one has to go beyond aggregate benefits and consider the heterogeneous effects of innovation on different consumer types, and the possibility that rapid elimination of basic configurations prevents the benefits from trickling down to price-sensitive consumers. Just the same, the paper’s analysis is constrained by its focus on short-run benefits. In particular, it misses certain long-term benefits from innovation, such as complementary innovations in software that are likely to trickle down to all consumer types. Additional research is, therefore, needed in order to fully appreciate the dramatic contribution of innovation in personal computing to economic growth and welfare.
Quite abruptly income inequality has returned to the political agenda as a prominent societal issue. At least part of this can be attributed to Piketty’s provoking premise of rising concentration at the top end of the income and wealth distribution in Capital in the Twenty-First Century (2014), providing some academic ground for the ‘We are the 99 percent’ Occupy movement slogan. Yet, this revitalisation of inequality is based on broader concerns than the concentration at the very top alone. There is growing evidence that earnings in the bottom and the middle of the distribution have hardly risen, if at all, during the last 20 years or so. Incomes are becoming more dispersed not only at the top, but also more generally within developed countries.
We should distinguish between increasing concentration at the top and the rise of inequality across the entire population. Even though both developments might take place simultaneously, the causes, consequences, and possible policy responses differ.
The most widely accepted explanation for rising inequality across the entire population is so-called skill-biased technological change. Current technological developments are particularly suited for replacing routine jobs, which disproportionally lie in the middle of the income distribution. In addition, low- and middle-skilled manufacturing jobs are gradually being outsourced to low-wage countries (see for instance Autor et al., 2013). Decreasing influence of trade unions and more decentralised levels of wage coordination are also likely to play a role in creating more dispersed earnings patterns.
Increased globalisation or technological change are not likely to be main drivers of rising top income shares, though the larger size of markets allows for higher rewards at the top. Since the rise of top income shares was especially an Anglo-Saxon phenomenon, and as the majority of the top 1 per cent in these countries comes from the financial sector, executive compensation practices play a role. Marginal top tax cuts implemented in these countries and inherited wealth are potentially important as well.
So should we care about these larger income differences? At the end of the day this remains a normative question. Yet, whether higher levels of inequality have negative effects on the size of our total wealth is a more technical issue, albeit not a less contested one in political economy. Again, we should differentiate between effects of increasing concentration at the top and the broader higher levels of inequality. To start with the latter, higher dispersion could incite people to put forth additional effort, as the rewards will be higher as well. Yet, when inequality of income disequalises opportunities, there will be an economic cost as Krugman also argues. Investment in human capital for instance will be lower as Standard & Poor’s notes for the US.
High top income shares do not lead to suboptimal human capital investment, but will disrupt growth if the rich use their wealth for rent-seeking activities. Stiglitz and Hacker and Pierson in Winner-Take All Politics (2010) argue that this indeed takes place in the US. On the other hand, a concentration of wealth could facilitate large and risky investments with positive externalities.
If large income differences indeed come at the price of lower total economic output, then the solution seems simple: redistribute income from the rich to the poor. Yet, both means-tested transfers and progressive taxes based on economic outcomes such as income will negatively affect economic growth as they lower the incentives to gain additional wealth. It might thus be that ‘the cure is worse than the disease’, as the IMF phrases this dilemma. Nevertheless, there can be benefits of redistribution in addition to lessening any negative effects of inequality on growth. The provision of public insurance could have stimulating effects by allowing individuals to take risks to generate income.
How to leave from here? First of all, examining whether inequality or redistribution affects growth requires data that makes a clean distinction between inequality before and after redistribution across countries over time. There are interesting academic endeavours trying to decompose inequality into a part resulting from differences in effort and a part due to fixed circumstances, such as gender, race, or educational level of parents. This can help our understanding which ‘types’ of inequality negatively affect growth and which might boost it. Moreover, redistribution itself can be achieved through multiple means, some of which, such as higher heritage taxes, are likely to be more pro-growth than others, such as higher income tax rates.
All things considered, whether inequality or redistribution hampers growth is too broad of a question. Inequality at which part of the distribution, due to what economic factors, and how the state intervenes all matter a great deal for total growth.
For me, my focus on helping teens transition from high school to adulthood began during the recession. I was working the help desk and there was a customer who was trying to complete the FAFSA on a paid website. I redirected them to FAFSA.ed.gov, but a few days later there was another customer who was doing a similar thing, only they had paid $80 for someone to fill out their Free Application for Federal Student Aid.
It may be the beginning of the school year, but one of my focuses this year is partnering with other organizations to ensure that accurate information gets to students and recent grads about college and alternatives to college.
We’ve divided our focus in two parts. In the fall we focus on promoting the services the library offers to prospective college students, while hosting SAT/ACT Practice Tests, and Finding $ for College Nights at the library.
I’ve found that most parents and students aren’t even aware that the public library often has study guides, scholarship listings, and college ranking guides that they can use to help decide where they want to go to school. We worked with Sylvan, Princeton Review, and Kaplan who host the Practice Tests and other information sessions. Library staff handout a targeted flyer to students who show up for the events that promotes our collections and e-sources related to college.
For our Finding $ for College programs we started with resources from the Department of Education. They offer a Financial Aid Toolkit and training for anyone who works with students and wants to share accurate information about paying for college. We created a library program that highlights FAFSA and scholarships, and explains the various ways to pay for a college education. We partner with local community colleges, who send a Financial Aid Advisor to answer parents specific questions. It has been very successful.
Last year we made a decision that as a public library we wanted to also emphasize that there are other valuable career choices if college isn’t the right fit for you. This past spring we worked with Labor & Industries to highlight apprenticeship programs available in the community, and invited members of these fields to talk to students about these career paths.
While we can only offer limited workshops to help recent grads with important skills like interviewing, resume writing, and professional appearance, we have partnered with a local organization that focuses on helping 16-24 year olds with their first job. We are also working on creating a targeted flyer that highlights the library’s print and electronic resources that help recent graduates make the transition. Recently I requested Soft Skills for Workplace Success from the Department of Labor, in hopes we might be able to create a successful program for this spring.
Lastly we have worked with credit unions and banks to offer financial literacy programs. Buying Your First Car has been a huge success, while Credit 101 has also been beneficial in our community. These programs are offered for free. Some branches have also used the free resources available from the Department of Treasury to help teens learn about being smart with their money.
Working with our Adult Services team has been invaluable as we develop and promote these programs. We also work with local schools to support their programs while filling in topics they aren’t able to teach their students.
What I’ve learned is that there are several free resources in our community and through various federal government programs. Working together as a team has made these programs easy to organize. They promote library services, while also supporting our communities. Initially our goal was to help teens see that the library has more to offer students than just databases that help them complete their research assignments for school. Now the library is a valuable link to help teens transition into adulthood, giving them information to make informed citizens and be better members of the local community.
I encourage you to see what resources are available near you and create partnerships with other departments in your library, local schools, and other organizations in your community.
My favorite part about all these programs has been going to fairs telling young adults about all the services we offer and seeing them get excited about basic things like checking out DVDs, Music CDs, and Books to entertain themselves while also getting support to gain independence and their first job.
On September 18, Scots will go to the polls to vote on the question “Should Scotland be an independent country?” A “yes” vote would end the political union between England and Scotland that was enacted in 1707.
The main economic reasons for independence, according to the “Yes Scotland” campaign, is that an independent Scotland would have more affordable daycare, free university tuition, more generous retirement and health benefits, less burdensome regulation, and a more sensible tax system.
As a citizen of a former British colony, it is tempting to compare the situation in Scotland with those of British colonies and protectorates that gained their independence, such as the United States, India/Pakistan, and a variety of smaller countries in Africa, Asia, and the Americas, although such a comparison is unwarranted.
Historically, independence movements have been motivated by absence of representation in the institutions of government, discrimination against the local population, and economic grievances. These arguments do not hold in the Scottish case.
Scotland is an integral part of the United Kingdom. It is represented in the British Parliament in Westminster, where it holds 9% of the seats—fair representation, considering that Scotland’s population is a bit less than 8.5% of total UK population.
Scotland does have a considerable measure of self-government. A Scottish Parliament, created in 1998, has authority over issues such as health, education, justice, rural affairs, housing and the environment, and some limited authority over tax rates. Foreign and defense policy remain within the purview of the British government.
Scots do not seem to have been systematically discriminated against. At least eight prime ministers since 1900, including recent ex-PMs Tony Blair and Gordon Brown, were either born in Scotland or had significant Scottish connections.
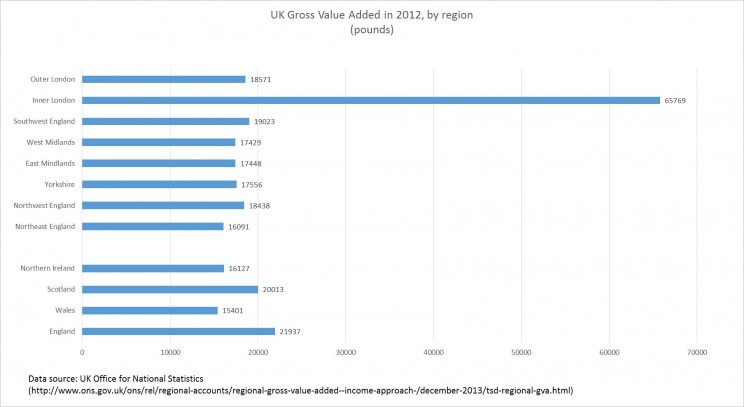
Scotland is about as prosperous as the rest of the UK, with output per capita greater than those of Wales, Northern Ireland, and England outside of London (see figure).
Because the referendum asks only whether Scotland should become independent and contains no further details on how the break-up with the UK would be managed, it is important to consider some key economic issues that will need to be tackled should Scotland declare its independence.
Graph showing UK Gross Value, created by Richard S. Grossman with data from the UK Office of National Statistics.
Since Scotland already has a parliament that makes many spending and taxing decisions, we know something about Scottish fiscal policy. According to the World Bank figures, excluding oil (a resource that is expected to decline in importance in coming decades), Scotland’s budget deficit as a share of gross domestic product already exceeds those of fiscally troubled neighbors Greece, Spain, Ireland, Portugal, and Italy. Given the “Yes” campaign’s promise to make Scotland’s welfare system even more generous, the fiscal sustainability of an independent Scotland’s is unclear.
As in any divorce, the parties would need to divide their assets and liabilities.
The largest component of UK liabilities are represented by the British national debt, recently calculated at around £1.4 trillion ($2.4 trillion), or about 90 percent of UK GDP. What share of this would an independent Scotland “acquire” in the break-up?
Assets would also have to be divided. One of the greatest assets—North Sea oil—may be more straightforward to divide given that the legislation establishing the Scottish Parliament also established a maritime boundary between England and Scotland, although this may be subject to negotiation. But what about infrastructure in England funded by Scottish taxes and Scottish infrastructure paid for with English taxes?
An even more contentious item is the currency that would be used by an independent Scotland. The pro-independence camp insists that an independent Scotland would remain in a monetary union with the rest of the UK and continue to use the British pound. And, in fact, there is no reason why an independent Scotland could not declare the UK pound legal tender. Or the euro. Or the US dollar, for that matter.
The problem is that the “owner” of the pound, the Bank of England, would be under no obligation to undertake monetary policy actions to benefit Scotland. If a sluggish Scottish economy is in need of loose monetary policy while the rest of the UK is more concerned about inflation, the Bank of England would no doubt carry out policy aimed at the best interests of the UK—not Scotland.
If a Scottish financial institution was on the point of failure, would the Bank of England feel duty-bound to lend pounds? As lender of last resort in England, the Bank has an obligation to supervise—and assist, via the extension of credit—troubled English financial institutions. It seems unlikely that an independent Scotland would allow its financial institutions to be supervised and regulated by a foreign power—nor would that power be morally or legally required to extend the UK financial safety net to Scotland.
At the time of this writing (the second half of August), the smart money (and they do bet on these things in Britain) is on Scotland saying no to independence, although poll results released on August 18 found a surge in pro-independence sentiment. Whatever the polls indicate, no one is taking any chances. Several Scottish-based financial companies are establishing themselves as corporations in England so that, in the case of independence they will not be at a foreigner’s disadvantage vis-à-vis their English clients. Given the economic uncertainty generated by the vote, the sooner September 18 comes, the better for both Scotland and the UK.
Headline image credit: Scottish Parliament building, by Jamieli. Public domain via Wikimedia Commons.
Bliss was it in that dawn to be alive
But to be young was very heaven!
– William Wordsworth on the French Revolution
I was not that young when New Europe’s transition began in 1989, but I was there: in Poland at the start of the 1990s and in Russia during its 1998 crisis and after, in both cases as the resident economist for the World Bank. This year is the 25th anniversary of New Europe’s transition and the sixth year of Old Europe’s growth-cum-sovereign debt crisis. Old Europe can learn from New Europe: first, about getting government debt dynamics under control if you want growth. Second, about implementing the policy trio of hard budgets, competition and competitive real exchange rates to keep debt dynamics under control and get growth. The contrasting experiences of Poland and Russia underline these lessons (Andrei Shleifer’s take on the transition lessons can be found here).
Poland started with a big bang in 1990, but ran into political roadblocks on the privatization of large state enterprises. It achieved single-digit inflation only in 1998. Between 1995 and 1998, Russia did the opposite. By early 1998, privatization was done and single-digit inflation achieved. But while Poland started growing in 1992 and has one of the most enviable growth records in Europe, Russia suffered a huge crisis in August 1998 after which it was forced to adopt the same policy agenda as Poland.
The first difference is that Poland quickly established fiscal discipline and capitalized on the debt reduction it received from the Paris and London Clubs to get government debt dynamics under control. Russia lost control over its government debt dynamics even as the central bank obsessively squeezed inflation out.
The second difference is that Poland instantly hardened budgets by slashing subsidies to state-owned enterprises (SOEs) and subsequently restricting bank lending to loss-making SOEs. It summarily increased competition by liberalizing imports, but was careful to avoid a large real appreciation by devaluing the zloty 17 months after the big bang, and then moving to a flexible exchange rate. The first two elements of this micropolicy trio, hard budgets and competition, forced SOEs to raise efficiency even before privatization. The third, competitive real exchange rates, gave them breathing space. Indeed, SOEs were in the forefront of the economic recovery which began in late 1992, ensuring that debt dynamics would remain sustainable. This does not mean privatization was irrelevant: SOE managers were anticipating it and expecting to benefit from it; but the immediate spur was definitely the micropolicy trio.
In contrast, Russia’s privatized manufacturing companies were coddled by budgetary subsidies and large subsidies implicit in the noncash settlements for taxes and energy payments that sprouted as real interest rates rose to astronomical levels. Persistent fiscal deficits and low credibility pushed nominal interest rates sky high even as the exchange rate was fixed in 1995 to bring inflation down. The resulting soft budgets, high real interest rates and real appreciation made asset stripping easier than restructuring enterprises, killing growth. Tax shortfalls became endemic, forcing increasingly expensive borrowing that placed government debt on an explosive trajectory and made the August 1998 devaluation, default and debt restructuring inevitable. But this shut the country out of the capital markets, at last hardening budgets. The real exchange rate depreciated massively, leading to a 5% rebound in real GDP in 1999 (against initial expectations of a huge contraction) as moribund firms became competitive and domestic demand switched from imports to domestic products. This policy mix was maintained after oil prices recovered in 2000, ensuring sustainable debt dynamics.
Old Europe, especially the periphery, can learn a lot from the above. Take Italy. By 2013, its real exchange rate had appreciated over 3% relative to 2007, while real GDP had contracted over 8%. The government’s debt-to-GDP ratio increased by 30 percentage points (and is projected to climb to 135% by the end of this year), while youth unemployment went from 20% to 40% over the same period! Italy has no control over the nominal exchange rate and lowering indebtedness through fiscal austerity will worsen already weak growth prospects. Indeed, Italy has slipped back into recession in spite of interest rates at multi-century lows and forbearance on fiscal austerity.
The counter argument is that indebtedness and competitiveness don’t look that bad for the Eurozone as a whole. However, this argument is vacuous without debt mutualisation, a fiscal union and a banking union with a common fiscal backstop, the latter to prevent individual sovereigns, such as Ireland and Spain, from having to shoulder the costs of fixing their troubled banks; the recent costly bailout of Banco Espirito Santo by Portugal is a timely reminder. Besides, Germany has to be willing to cross-subsidize the periphery. Even then, this would only be a start. As a recent IMF report warns, the Eurozone is at risk of stagnation from insufficient demand (linked to excessive debt), a weak and fragmented banking system and stalled structural reform required for increasing competition and raising productivity. Debtor countries are hamstrung by insufficient relative price adjustment (read “insufficient real depreciation”).
The corrective agenda for the Eurozone has much in common with the “debt restructuring-cum-micro policy trio” agenda emerging from the Polish and Russian transition experience. The question is whether the Eurozone can have meaningful growth prospects based on banking and structural reform without an upfront debt restructuring. The answer from New Europe’s experience is “No.” Debt restructuring will result in a temporary loss of confidence and possibly even a recession; but it will also lead to a large real depreciation and harden budgets, spurring governments to complete structural reform, thereby laying the foundation for a brighter future. The key is not the debt restructuring, but whether government behaviour changes credibly for the better following it. As the IMF report observes, progress “may be prone to reform fatigue” with the rally in financial markets. In other words, the all-time lows in interest rates set in train by ECB President Draghi’s July 2012 pledge to do whatever it takes to save the euro is fuelling procrastination even as indebtedness grows and growth prospects dim. Rising US interest rates as the recovery there takes hold and the growing geopolitical risk over Ukraine, which will hurt the Eurozone more than the US, only worsen the picture. The Eurozone has a stark choice: take the pain now or live with a stagnant future, meaning its youth have fewer jobs today and more debt to pay off tomorrow.
In 1985, Nobel Laureate Gary Becker observed that the gap in employment between mothers and fathers of young children had been shrinking since the 1960s in OECD countries. This led Becker to predict that such sex differences “may only be a legacy of powerful forces from the past and may disappear or be greatly attenuated in the near future.” In the 1990s, however, the shrinking of the mother-father gap stalled before Becker’s prediction could be realized. In today’s economy, how big is this mother-father employment gap, what forces underlie it, and are there any policies which could close it further?
A simple way to characterize the mother-father employment gap is to sum up how much more work is done by mothers compared to fathers of children from ages 0 to 10. In 2010, fathers in the United States worked 3.1 more years on average than mothers over this age 0 to 10 age range. In the United Kingdom, the comparable number is 3.8, while in Canada it is 2.9 and Germany 4.5. The figure below traces the evolution of this mother-father employment gap for all four of these countries.
Graph shows the difference in years worked by mothers and fathers when their children are between the ages of 0 to 10. (Graph credit: Milligan, 2014 CESifo Economic Studies)
Becker’s theorizing about the family can help us to understand the development of this mother-father employment gap. Becker’s theoretical models suggest that if there are even slight differences between the productivity of mothers and fathers in the home vs. the workplace, spouses will tend to specialize completely in either in-home or in out-of-home work. These kind of productivity differences could arise because of cultural conditioning, as society pushes certain roles and expectations on women and men. Also, biology could be important as women have a heavier physical burden during pregnancy and after the birth of a child women have an advantage in breastfeeding. It is possible that the initial impact of these unique biological roles for mothers lingers as their children age. Biology is not destiny, but should be acknowledged as a potential barrier that contributes to the origins of the mother-father work gap.
Will today’s differences in mother-father work patterns persist into the future? To some extent that may depend on how cultural attitudes evolve. But there’s also the possibility that family-friendly policy can move things along more quickly. Both parental leave and subsidized childcare are options to consider.
Analysis of some data across the four countries suggest that these kinds of policies can make some difference, but the impact is limited.
Parental leave makes a very big difference when the children are age zero and the parent is actually taking the leave—but because mothers take much more parental leave than fathers, this increases the mother-father employment gap rather than shrinking it. Evidence suggests that after age 0 when most parents return to work, there doesn’t seem to be any lasting impact of having taken a maternity leave on mothers’ employment patterns when their children are ages 1 to 10.
Another policy that might matter is childcare. In the Canadian province of Quebec, a subsidized childcare program was put in place in 1997 that required parents to pay only $5 per day for childcare. This program not only increased mothers’ work at pre-school ages, but also seems to have had a lasting impact when their children reach older ages, as employment of women in Quebec increased at all ages from 0 to 10. When summed up over these ages, Quebec’s subsidized childcare closed the mother-father employment gap by about half a year of work.
Gary Becker’s prediction about the disappearance of mother-father work gaps hasn’t come true – yet. Evidence from Canada, Germany, the United States, and the United Kingdom suggests that policy can contribute to a shrinking of the mother-father employment gap. However, the analysis makes clear that policy alone may not be enough to overcome the combination of strong cultural attitudes and any persistence of intrinsic biological differences between mothers and fathers.
Digital Inclusion is more than Digital Literacy, focusing on not just access but supporting users to engage in digital communities. The report explored the roles of public libraries in four main areas:
Quality access to digital technology
Access to a range of digital content
Services and programs that promote digital literacy
Programs that address key community needs, such as health and wellness and education, and that promote workforce development and civic engagement.
Overwhelmingly what we discovered is that libraries have increased access to computer workstations and faster internet and technology infrastructure like outlets and wireless printing.
All libraries offer access to online databases.
Almost all libraries offer homework assistance.
Most libraries offer access to e-books,
While over a quarter of libraries provide patrons with e-readers to check out.
The survey has also documented the innovations that are happening in libraries like Mobile Technology and 3D Printers which have been adopted in 1.5% of libraries.
What the survey highlighted is that while we are providing access to technology and content we are creating a different type of digital divide.
City Libraries are able to
make more upgrades to technology infrastructure like workstations and outlets,
offer an Average Internet Download Speed that is 5X faster than Rural Libraries.
Only 32.5 percent of rural libraries can support formal technology classes,
while 77.6 of city libraries offer formal computer skills training
100% of city libraries surveyed reported that they offer either formal or informal technology training.
We know that rural communities have less access to resources, but as we work to support STEM in schools these gaps can put communities even further behind.
In addition to being an information center, many libraries serve as a central location where members can gather to foster community.
Over half of Suburban and City Libraries host community engagement events
while less than half of town libraries and less than one-third of rural libraries are able to engage and support the community in this way.
As more and more people connect online, the library can be one of the few places where the public can engage with members of the community, be exposed to diversity, and gain a better appreciation for and connect to their neighbors in a comfortable and relaxed environment. While hosting a book club, candidate forum, or gaming seems small, these can be one of the few places in the community outside of school where everyone has a chance to interact and participate.
Lastly Health and Wellness is an area we can all improve. With the move to National Health Care, and the confusion of much of the public I expected to see many libraries offering programs and support, but a mere 37% of surveyed libraries offered programs that assisted patrons in finding and accessing health insurance information.
The one area of Health and Wellness that libraries are addressing is promotion of a healthy lifestyle, but only 55% of libraries offer these types of programs and it drops to 44% for Rural Libraries.
We have made many strides since the last study was conducted in 1994, but we still have a long way to go. With so many free online courses available libraries have even more access to resources than they did before. We can partner with organizations like Workforce Career and Job Training, CoderDojo, Code.org, Healthcare.gov, local health providers, and other community organizations to help serve patrons and create a more informed citizenry.
This is the first survey to provide detailed data about how libraries are serving the public. As we apply for grants to support the needs of our communities, I hope this survey helps frame the needs of our library users.
Ipac has framed the survey results in the context of the communities libraries serve. You can access a mapping tool online at http://digitalinclusion.umd.edu to explore the services available in your community.
As an early-stage graduate student in the 1980s, I took a summer off from academia to work at an investment bank. One of my most eye-opening experiences was discovering just how much effort Wall Street devoted to “Fed watching”, that is, trying to figure out the Federal Reserve’s monetary policy plans.
If you spend any time following the financial news today, you will not find that surprising. Economic growth, inflation, stock market returns, and exchange rates, among many other things, depend crucially on the course of monetary policy. Consequently, speculation about monetary policy frequently dominates the financial headlines.
Back in the 1980s, the life of a Fed watcher was more challenging: not only were the Fed’s future actions unknown, its current actions were also something of a mystery.
You read that right. Thirty years ago, not only did the Fed not tell you where monetary policy was going but, aside from vague statements, it did not say much about where it was either.
Given that many of the world’s central banks were established as private, profit-making institutions with little public responsibility, and even less public accountability, it is unremarkable that central bankers became accustomed to conducting their business behind closed doors. Montagu Norman, the governor of the Bank of England between 1920 and 1944 was famous for the measures he would take to avoid of the press. He adopted cloak and dagger methods, going so far as to travel under an assumed name, to avoid drawing unwanted attention to himself.
The Federal Reserve may well have learned a thing or two from Norman during its early years. The Fed’s monetary policymaking body, the Federal Open Market Committee (FOMC), was created under the Banking Act of 1935. For the first three decades of its existence, it published brief summaries of its policy actions only in the Fed’s annual report. Thus, policy decisions might not become public for as long as a year after they were made.
Limited movements toward greater transparency began in the 1960s. By the mid-1960s, policy actions were published 90 days after the meetings in which they were taken; by the mid-1970s, the lag was reduced to approximately 45 days.
Since the mid-1990s, the increase in transparency at the Fed has accelerated. The lag time for the release of policy actions has been reduced to about three weeks. In addition, minutes of the discussions leading to policy actions are also released, giving Fed watchers additional insight into the reasoning behind the policy.
More recently, FOMC publicly announces its target for the Federal Funds rate, a key monetary policy tool, and explains its reasoning for the particular policy course chosen. Since 2007, the FOMC minutes include the numerical forecasts generated by the Federal Reserve’s staff economists. And, in a move that no doubt would have appalled Montagu Norman, since 2011 the Federal Reserve chair has held regular press conferences to explain its most recent policy actions.
The Fed is not alone in its move to become more transparent. The European Central Bank, in particular, has made transparency a stated goal of its monetary policy operations. The Bank of Japan and Bank of England have made similar noises, although exactly how far individual central banks can, or should, go in the direction of transparency is still very much debated.
Despite disagreements over how much transparency is desirable, it is clear that the steps taken by the Fed have been positive ones. Rather than making the public and financial professionals waste time trying to figure out what the central bank plans to do—which, back in the 1980s took a lot of time and effort and often led to incorrect guesses—the Fed just tells us. This make monetary policy more certain and, therefore, more effective.
Greater transparency also reduces uncertainty and the risk of violent market fluctuations based on incorrect expectations of what the Fed will do. Transparency makes Fed policy more credible and, at the same time, pressures the Fed to adhere to its stated policy. And when circumstances force the Fed to deviate from the stated policy or undertake extraordinary measures, as it has done in the wake of the financial crisis, it allows it to do so with a minimum of disruption to financial markets.
Montagu Norman is no doubt spinning in his grave. But increased transparency has made us all better off.
Subscribe to the OUPblog via email or RSS.
Subscribe to only business and economics articles on the OUPblog via email or RSS.
Image credits: (1) Federal Reserve, Washington, by Rdsmith4. CC-BY-SA-2.5 via Wikimedia Commons. (2) European Central Bank, by Eric Chan. CC-BY-2.0 via Wikimedia Commons.
Adaptation to climate change is currently high on the agenda of EU bureaucrats exploring the regulatory scope of the topic. Climate change may potentially bring about changes in the frequency of extreme weather events such as heat waves, flooding or thunder storms, which in turn may require adaptation to changes in our living conditions. Adaptation to these conditions cannot stop climate change, but it can reduce the cost of climate change. Building dikes protects the landscape from an increase in sea level. New vaccines protect the population from diseases that may spread due to the change in the climate. Leading politicians, the media and prominent interest groups call for more efforts in adaptation.
But who should be in charge? Do governments have to play a leading role in adaptation? Will firms and households make the right choices? Or do governments have to intervene to correct insufficient or false adaptation choices? If intervention is necessary, will the policy have to be decided on a local level or on a national or even supranational (EU) level? In a recent article we review the main arguments for government intervention in climate change adaptation. Overall, we find that the role of the state in adaptation policy is limited.
In many cases, adaptation decisions can be left to private individuals or firms. This is true if private sector decision-makers both bear the cost and enjoy the benefits of their own decisions. Superior insulation of buildings is a good example. It shields the occupants of a building from extreme temperatures during cold winters and hot summers. The occupants – and only the occupants – benefit from the improved insulation. They also bear the costs of the new insulation. If the benefit exceeds the cost, they will invest in the superior insulation. If it does not pay off, they will refrain from the adaptation measure (and they should do so from an efficiency point of view). There is no need for government intervention in the form of building regulation or rehabilitation programmes.
In some other cases, adaptation affects an entire community as in the case of dikes. A single household will hardly be able – nor have the incentive – to build a dike of the appropriate size. But the local municipality can and should be able to so. All inhabitants of the municipality can share the costs and appropriate the benefit from flood protection. The decision on the dike could be made on the state level if not at the municipal level. The local population will probably have a long-standing experience and superior knowledge about the flood events and its potential damages. The subsidiarity principle, which is a major principle of policy task assignment in the European Union, suggests that the decisions should be made on the most decentralized level for which there are no major externalities between the decision-makers. In the case of the dike, the appropriate level for the adaptation measure would be the municipality. Again there is no need for intervention from upper-level governments.
So what role is left for the upper echelons of government in climate change adaptation? Firstly, the government has to help in improving our knowledge. Information about climate change and information about technical adaptation measures are typical public goods: the cost of generating the information has to be incurred once, whereas the information can be used at no additional cost. Without government intervention, too little information would be generated. Therefore, financing basic research in this area is one of the fundamental tasks for a central government.
Secondly, the government has to provide the regulatory framework for insurance markets. The economic consequences of natural disasters can be cushioned through insurance markets. However, the incentives to buy insurance are insufficient for several reasons. For instance, whenever a major disaster threatens the economic existence of a larger group of citizens, the government is under social pressure and will typically provide help to all those in need. By anticipating government support in case of a disaster, there is little or no incentive to buy insurance in the market. Why should they pay the premium for private insurance, or invest in self-insurance or self-protection measures if they enjoy a similar amount of free protection from the government? If the government wants to avoid being pressured for disaster relief, it has to make disaster insurance mandatory. And to induce citizens to the appropriate amount of self-protection, insurance premiums have to be differentiated according to local disaster risks.
Thirdly, fostering growth helps coping with the consequences of climate change and facilitates adaptation. Poor societies and population groups with low levels of education have the highest exposure to climate change, whereas richer societies have the means to cope with the implications of climate change. Hence, economic growth – properly measured – and education should not be dismissed easily as they act as powerful self-insurance devices against the uncertain future challenges of climate change.
Kai A. Konrad is Director at the Max Planck Institute for Tax Law and Public Finance. Marcel Thum is Professor of Economics at TU Dresden and Director of ifo Dresden. They are the authors of the paper ‘The Role of Economic Policy in Climate Change Adaptation’ published in CESifo Economic Studies.
CESifo Economic Studies publishes provocative, high-quality papers in economics, with a particular focus on policy issues. Papers by leading academics are written for a wide and global audience, including those in government, business, and academia. The journal combines theory and empirical research in a style accessible to economists across all specialisations.
Subscribe to the OUPblog via email or RSS.
Subscribe to only business and economics articles on the OUPblog via email or RSS.
Image credit: Flooding, July 2007, by Mat Fascoine. CC-BY-SA-2.0 via Wikimedia Commons.
In most studies of economic growth the downloaded data from international databases is treated as primary evidence, although in fact it is not. The data available from the international series has been obtained from governments and statistical bureaus, and has then been modified to fit the purpose of the data retailer and its customers. These alterations create some problems, and the conclusions of any study that compares economic performance across several countries depend on which source of growth evidence is used.
The international databases provide no proper sources for their data and no data that would enable analysts to understand why the different sources disagree about growth. See, for example, the disagreement in economic growth series reported by the national statistical office, from Penn World Tables, The World Bank, and the Maddison dataset for Tanzania, 1961-2001.
The average annual disagreement between 1961 and 2001 is 6%. It is not evenly distributed; there is serious dissonance regarding growth in Tanzania in the 1980s and 1990s, and how the effects of economic crisis and structural adjustment affected theeconomy depends on which source you consult.
The problem is that growth evidence in the databases covers years for which no official data was available and the series are compiled from national data that use different base years. The only way to deal satisfactorily with inconsistencies in the data and the effects of revisions is to consult the primary source. The official national accounts are the primary sources.
The advantage of using the national accounts as published by the statistical offices is that they come with guidelines and commentaries. When the underlying methods or basic data used to assemble the accounts are changed, these changes are reported. The downside of the national accounts evidence is that the data is not readily downloadable. The publications may have to be manually collected, and then the process of data entry and interpretation follows. When such studies of growth are done carefully, it offers reconsiderations of what used to be accepted wisdom of economic growth narratives.
I propose a reconsideration of economic growth in Africa in three respects. First, that the focus has been on average economic growth and that there has been no failure of economic growth. In particular the gains made in the 1960s and 1970s have been neglected.
Secondly, for many countries the decline in economic growth in the 1980s was overstated, as was the improvement in economic growth in the 1990s. The coverage of economic activities in GDP measures is incomplete. In the 1980s many economic activities were increasingly missed in the official records thus the decline in the 1980s was overestimated (resulting from declining coverage) and the increase in the 1990s was overestimated (resulting from increasing coverage).
The third important reconsideration is that there is no clear association between economic growth and orthodox economic policies. This is counter to the mainstream interpretation, and suggests that the importance of sound economic policies has been overstated, and that the importance of the external economic conditions have been understated in the prevailing explanation of African economic performance.
We know less than we would like to think about growth and development in Africa based on the official numbers, and the problem starts with the basic input: information. The fact of the matter is that the great majority of economic transactions whether in the rural agricultural sector and in the medium and small scale urban businesses goes by unrecorded.
This is just not a matter of technical accuracy; the arbitrariness of the quantification process produces observations with very large errors and levels of uncertainty. This ‘numbers game’ has taken on a dangerously misleading air of accuracy, and international development actors use the resulting figures to make critical decisions that allocate scarce resources. Governments are not able to make informed decisions because existing data is too weak or the data they need does not exist; scholars are making judgments based on erroneous statistics.
Since the 1990s, in the study of economics, the distance between the observed and the observer is increasing. When international datasets on macroeconomic variables became available, such as the Penn World Tables, and the workhorse of study of economic growth became the cross-country growth regressions the trend turned away from carefully considered country case studies and then rather towards large country studies interested in average effects.
However, the danger of such studies is that it does not ask the right kind of questions of the evidence. As an economic historian, I approach the GDP evidence with the normal questions in source criticism: How good is this observation? Who made this observation? And under what circumstance was this observation made?
Morten Jerven is an economic historian and holds a PhD from the London School of Economics. Since 2009, he has been Assistant Professor at the School for International Studies at Simon Fraser University. He is author of Economic Growth and Measurement Reconsidered in Botswana, Kenya, Tanzania, and Zambia, 1965-1995 and has published widely on African economic development, and particularly on patterns of economic growth and economic development statistics.
Subscribe to the OUPblog via email or RSS.
Subscribe to only business and economics articles on the OUPblog via email or RSS.
Image credit: Tanzanian farmers, by Fanny Schertzer. CC-BY-2.5 S.A via Wikimedia Commons.
What do the Irish famine and the euro crisis have in common?
The famine, which afflicted Ireland during 1845-1852, was a humanitarian tragedy of massive proportions. It left roughly one million people—or about 12 percent of Ireland’s population—dead and led an even larger number to emigrate.
The euro crisis, which erupted during the autumn of 2009, has resulted in a virtual standstill in economic growth throughout the Eurozone in the years since then. The crisis has resulted in widespread discontent in countries undergoing severe austerity and in those where taxpayers feel burdened by the fiscal irresponsibility of their Eurozone partners.
Despite these widely differing circumstances, these crises have an important element in common: both were caused by economic policies that were motivated by ideology rather than cold hard economic analysis.
The Irish famine came about when the infestation of a fungus, Phythophthora infestans, led to the decimation of the potato crop. Because the Irish relied so heavily on potatoes for food, this had a devastating effect on the population.
At the time of the famine, Ireland was part of the United Kingdom. Britain’s Conservative government of the time, led by Prime Minister Sir Robert Peel, swiftly undertook several measures aimed at alleviating the crisis, including arranging a large shipment of grain from the United States in order to offer temporary relief to those starving in Ireland.
More importantly, Peel engineered a repeal of the Corn Laws, a set of tariffs that kept grain prices high. Because the Corn Laws benefitted Britain’s landed aristocracy—an important constituency of the Conservative Party, Peel soon lost his job and was replaced as prime minister by the Liberal Party’s Lord John Russell.
Russell and his Liberal Party colleagues were committed to an ideology that opposed any and all government intervention in markets. Although the Liberals had supported the repeal of the Corn Laws, they opposed any other measures that might have alleviated the crisis. Writing of Peel’s decision to import grain, Russell wrote: “It must be thoroughly understood that we cannot feed the people. It was a cruel delusion to pretend to do so.”
Contemporaries and historians have judged Russell’s blind adherence to economic orthodoxy harshly. One of the many coroner’s inquests that followed a famine death recommended that a charge of willful murder be brought against Russell for his refusal to intervene in the famine.
The euro was similarly the result of an ideologically based policy that was not supported by economic analysis.
In the aftermath of two world wars, many statesmen called for closer political and economic ties within Europe, including Winston Churchill, French premiers Edouard Herriot and Aristide Briand, and German statesmen Gustav Stresemann and Konrad Adenauer.
The post-World War II response to this desire for greater European unity was the European Coal and Steel Community, the European Economic Community, and eventually, the European Union each of which brought increasingly closer economic ties between member countries.
By the 1990s, European leaders had decided that the time was right for a monetary union and, with the Treaty of Maastricht (1993), committed themselves to the establishment of the euro by the end of the decade.
The leap from greater trade and commercial integration to a monetary union was based on ideological, rather than economic reasoning. Economists warned that Europe did not constitute an “optimal currency area,” suggesting that such a currency union would not be successful. The late German-American economist Rüdiger Dornbusch classified American economists as falling into one of three camps when it came to the euro: “It can’t happen. It’s a bad idea. It won’t last.”
The historical experience also suggested that monetary unions that precede political unions, such as the Latin Monetary Union (1865-1927) and the Scandinavian Monetary Union (1873-1914), were bound to fail, while those that came after political union, such as those in the United States in 18th century, Germany and Italy in the 19th century, and Germany in the 20th century were more likely to succeed. The various European Monetary System arrangements in the 1970s, none of which lasted very long, also provided evidence that European monetary unification was not likely to be smooth.
Concluding that it was a mistake to adopt the euro in the 1990s is, of course, not the same thing as recommending that the euro should be abandoned in 2014. German taxpayers have every reason to resent the cost of supporting their economically weaker—and frequently financially irresponsible—neighbors. However, Germany’s prosperity rests in large measure on its position as Europe’s most prolific exporter. Should Germany find itself outside the euro-zone, using a new, more expensive German mark, German prosperity would be endangered.
What we can say about the response to the Irish Famine and the decision to adopt the euro is that they were made for ideological, rather than economic reasons. These—and other episodes during the last 200 years—show that economic policy should never be made on the basis of economic ideology, but only on the basis of cold, hard economic analysis.
Subscribe to the OUPblog via email or RSS.
Subscribe to only business and economics articles on the OUPblog via email or RSS.
Image credits: (1) Irish potato famine, Bridget O’Donnel. Public domain via Wikimedia Commons. (2) Sir Robert Peel, portrait. Public domain via Wikimedia Commons.
From Greece to the United States, across Europe and in South America – sovereign debt and the shadow of sovereign debt crisis have loomed over states across the world in recent decades. Why is sovereign debt such a pressing problem for modern democracies? And what are the alternatives? In this video Lee Buchheit discusses the emergence of sovereign debt as a global economic reality. He critiques the relatively recent reliance of governments on sovereign debt as a way to manage budget deficits. Buchheit highlights in particular the problems inherent in expecting judges to solve sovereign debt issues through restructuring. As he explores the legal, financial and political dimensions of sovereign debt management, Buchheit draws a provocative conclusion about the long-term implications of sovereign debt, arguing that “what we have done is to effectively preclude the succeeding generations from their own capacity to borrow”.
Buchheit speaks at the launch of Sovereign Debt Management, edited by Rosa M. Lastra and Lee C. Buchheit.
Lee C. Buchheit is a partner based in the New York office of Cleary Gottlieb Steen & Hamilton LLP. Dr Rosa María Lastra, who introduces Buchheit’s lecture, is Professor in International Financial and Monetary Law at the Centre for Commercial Law Studies (CCLS), Queen Mary, University of London.
Subscribe to the OUPblog via email or RSS.
Subscribe to only law articles on the OUPblog via email or RSS.


![fafsa[1]](http://yalsa.ala.org/blog/wp-content/uploads/2014/08/fafsa1.jpg)