In celebration of Black History Month, Social Explorer has put together an interactive infographic with statistics from the most recent Census and American Community Survey. Dig into the data to find out about current African American household ownership, employment rates, per capita income, and more demographic information.
Take a sneak peak below and visit Social Explorer Presents Black History Month for the full, interactive infographic.
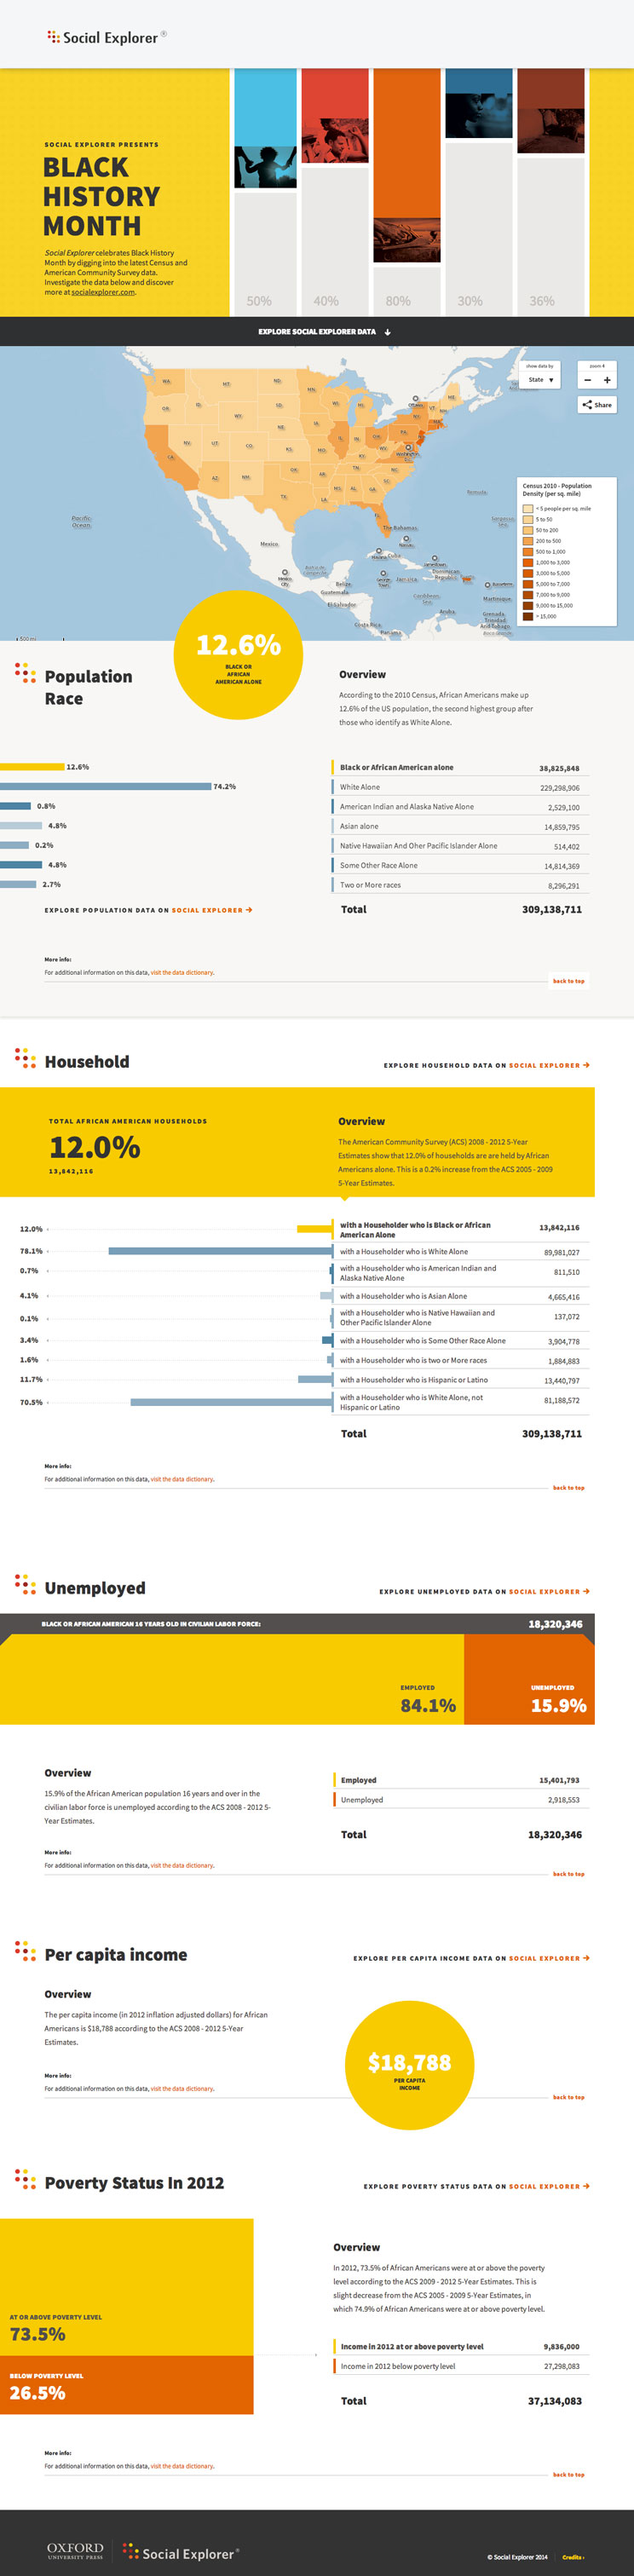
Social Explorer provides quick and easy access to current and historical census data and demographic information. The easy-to-use web interface lets users create maps and reports to illustrate, analyze, and understand demography and social change. In addition to its comprehensive data resources, Social Explorer offers features and tools to meet the needs of demography experts and novices alike. From research libraries to classrooms to government agencies to corporations to the front page of the New York Times, Social Explorer helps the public engage with society and science.
Subscribe to the OUPblog via email or RSS.
Subscribe to only social sciences articles on the OUPblog via email or RSS.
The post African American demography [infographic] appeared first on OUPblog.

By Sydney Beveridge
 Cupid scours a trove of demographic data to guide his arrows. This Valentine’s Day, let Social Explorer help you map your way to love.
Look up information on the 59.7 million available men and 67.4 million available women across the nation (available meaning unmarried, divorced, separated or widowed). These bachelors and bachelorettes can be sorted by age group, geography and more as you develop your demographic dating plan.
Map of 2010 American Community Survey Never Married Population

 For instance, Donald Demographics wants to know where the single ladies are. Using the data sorted by city, he can identify where lots of available women dwell. Since he has a thing for women with accents, he can refer to the “Sex By Place Of Birth By Year Of Entry For The Foreign-Born Population” table to help find an international lady.
Debbie Data is looking for a smart, financially stable man. She can use Social Explorer’s “Median Earnings By Sex By Educational Attainment (In 2010 Inflation Adjusted Dollars) (For Population Age 25+)” table to see which neighborhoods she should hang out in to find more of such guys.
She can even target neighborhoods where more people have health insurance — a really hot trait — by using the “Health Insurance Coverage Status By Sex By Age” table.
She also has a thing for arty types, and can keep an eye out for areas with more men in that occupation by consulting the “Sex by Industry” table. More into an outdoorsy crowd? Try areas with larger numbers of men or women in farming, fishing and forestry.
Check out Social Explorer’s maps and reports for more information on dating possibilities in your neighborhood and beyond. It’s the perfect opportunity to try out our custom colors in pink, red and more.
Happy Valentine’s Day from Social Explorer!
 Sydney Beveridge is the Media and Content Editor for Social Explorer, where she works on the blog, curriculum materials, how-to-videos, social media outreach, presentations and strategic planning. She is a graduate of Swarthmore College and the Columbia University Graduate School of Journalism.
By Sydney Beveridge
Some of the earliest detailed census data on education came from 1850 when the census reported information about school attendance. For many decades, the census focused on literacy rates, which we discussed in part two of the back to school series.
By the mid-1900s, data on educational attainment emerged (elementary school, high school, college, etc.), adding new insight into education

By Sydney Beveridge, Social Explorer
With the new school year approaching, Social Explorer is taking a closer look at education data today and over the years.
The most recent available data (from the 2009 American Community Survey) reveal education levels and distinctions among groups, as well as the correlations between educational attainment, income and employment.


Great review. The cover is gorgeous!