By Irina A. Telyukova
In the United States, around 25% of households tend have a substantial amount of expensive credit card debt that they carry over multiple months or even years, while also holding significant liquid assets, i.e. balances in checking and savings accounts.
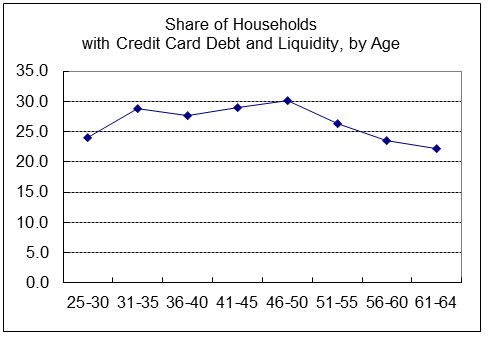
For example, in 2001 data, such households paid an average 14% interest rate on the credit card, while earning nearly no return on the bank accounts. A median such household had $3800 in credit card debt, and $3000 in the bank. The average amounts were about $5800 and $7200, respectively. This behavior is quite persistent with age, as the picture below shows. It is also persistent over time, at least over the last two decades. The statistics for 2010 are very close to those for 2001.
It may seem that given the cost of revolving credit card debt, people should pay it off if they have any money in the bank. Hence, the phenomenon has been termed the “credit card debt puzzle”. Much of the discussion of it in the literature interpreted it as evidence that people lack self-control, or that they lack the financial sophistication to plan properly. In my study, I instead focused on a more familiar idea: that people hold on to money in the bank because they may need it for expenses for which credit cannot be used, and such expenses could be large and unexpected. Not only do we pay our rents and mortgages still largely by check or electronic payment from the bank, but if we have a large car or home repair to take care of, the contractor might give preferential pricing to a cash payment or simply not accept credit cards. Indeed I find that homeowners are more likely to simultaneously have debt and money in the bank, and that home repairs are an important source of large and unpredictable expenses for most households. Then, even if a household has credit card debt, it may not be optimal to draw down the bank account to zero to repay the debt. Incidentally, this idea has been advanced in the past by those who have studied the same behavior on the side of firms.
 The story is intuitive; the difficult part is measuring how well this explanation can account for the puzzle, because we do not have good data on how people pay for things during a typical month, and because it is difficult to disentangle which expenses are unpredictable. Nevertheless, using several household surveys and a model of household portfolio choice, I measured both typical monthly liquid expenses (i.e. those done by cash, check, debit and other ways that require the bank account to have a positive balance), and the extent of uncertainty in them. I find that for the median person, there appears to be enough uncertainty to warrant holding on the order of $3,000 of liquid assets, even if she has credit card debt as well. In other words, many people who simultaneously have credit card debt and money in the bank are behaving without violation of self-control or rationality, under the constraint that they do not have enough money both to pay off their debt and attend to their expected monthly expense needs.
While the story accounts for the median amount of money held in the bank by those who also have credit card debt, the average household has a lot more money in the bank, and more money than credit card debt. This means that there are people who have very large amounts of liquid assets while still revolving credit card debt. While such households may face more severe risks than the average case that I measured, and while some may hold money in the bank because they foresee a possibility of a job loss and want to be able to pay at least their average expenses, it does suggest that some people may be able to improve their financial positions by examining their bank and credit card balances, and the interest costs that they pay on the credit card debt, to see if they can pay off some of their debt using their money in the bank.
Irina A. Telyukova is an assistant professor of economics at the University of California, San Diego. Her research focuses on different aspects of household saving. She has several publications on credit card debt and money demand. Her current research is about the use of home equity in retirement, in the United States and across countries, including a study about reverse mortgages. She is the author of the paper ‘Household Need for Liquidity and the Credit Card Debt Puzzle’, which appears in The Review of Economic Studies.
The Review of Economic Studies aims to encourage research in theoretical and applied economics, especially by young economists. It is widely recognised as one of the core top-five economics journal, with a reputation for publishing path-breaking papers, and is essential reading for economists.
Subscribe to the OUPblog via email or RSS.
Subscribe to only business and economics articles on the OUPblog via email or RSS.
Image Credits: (1) Graph produced by the author. Do not reproduce without permission. (2) Credit Card. By Gökhan ARICI, iStockphoto
The post Why don’t people pay off credit card debt? appeared first on OUPblog.


