 by John Jackson Miller
Comics sales months in the mirror may be smaller than they appear. That’s one of the lessons of the data released today byDiamond Comic Distributors about comics sales in March 2014, as analyzed by Comichron. Click to see the comics sales estimates for March 2014.
March’s sales to comics shops overall only represented a slight cooldown from March a year ago — and as reported here on Friday, the big action was in the graphic novel sector. Walking Dead Vol. 20 led the graphic novel charts — and with Saga Vol. 3 and an expensive Stray Bullets volume in the Top 10, Image posted its highest market share since November 2000, with an 11.38% dollar share. (November 2000‘s mark was 12.54%.) But while March 2013′s numbers posed a difficult comparative to beat — I called it a “blockbuster for this time of year” — going inside the numbers shows that last year’s totals were a bit of a mirage.
The Top 300 graphic novels this March, for example, were actually down 4% versus March 2013—even though the graphic novel category overall last month was up 18.31%. Why such a discrepancy? Because as Comichron noted at the time, March 2013′s graphic novel charts were artificially inflated by Marvel’s deep-discounting of several million dollars’ worth of hardcovers. So March 2013′s Top 300 graphic novels had a total retail value of $8.97 million versus $8.65 million this March —but the publishers and Diamond realized far less money from them.
The overall graphic novel percentage changes that Diamond reports, meanwhile, are calculated based on wholesale value — how much money retailers paid — and there, it’s clear that while more dollars worth of material moved through the system in March 2013, discounts weren’t as deep on what Diamond sold this year, and it and publishers realized more from the sales.
If we take the analysis down to units, we see that this March’s 300th-place graphic novel sold 490 copies, whereas last March’s book in that spot sold only 413. So we’re really looking at a comparison with a March 2013 chart that was seriously distorted by a lot of high-dollar value books sold at very high discounts.
The 300th-place comic book sold 4,940 copies this March versus 4,077 last March — almost exactly ten times the number of graphic novels sold in that spot in each month we’re comparing.
Meanwhile, on the five-year comparison tracks, we’re finally comparing against recessionary months in the Direct Market — the boost lent by the Obama Spider-Man issue in January and February 2009 was no longer in the picture. The market may have sold a million fewer comics in the Top 300 in March 2014 versus March 2013, but it sold a million more than in March 2009.
The aggregate change figures:
TOP 300 COMICS UNIT SALES
March 2014: 6.22 million copies
Versus 1 year ago this month: -14%
Versus 5 years ago this month: +17%
Versus 10 years ago this month: -2%
Versus 15 years ago this month: -4%
YEAR TO DATE: 20.93 million copies, -13% vs. 2013, +10% vs. 2009, +8% vs. 2004, -1% vs. 1999
ALL COMICS UNIT SALES
March 2014 versus one year ago this month: -11.83%
YEAR TO DATE: -11.40%
—
TOP 300 COMICS DOLLAR SALES
March 2014: $22.98 million
Versus 1 year ago this month: -11%
Versus 5 years ago this month: +29%
Versus 10 years ago this month: +23%
Versus 15 years ago this month: +42%
YEAR TO DATE: $68 million, -10% vs. 2013, +21% vs. 2009, +41% vs. 2004, +44% vs. 1999
ALL COMICS DOLLAR SALES
March 2014 versus one year ago this month: -9.47%
YEAR TO DATE: -6.89%
—
TOP 300 TRADE PAPERBACK DOLLAR SALES
March 2014: $8.65 million
Versus 1 year ago this month: -4%
Versus 5 years ago this month: -26%
Versus 10 years ago this month, just the Top 100 vs. the Top 100: +1
Versus 15 years ago this month, just the Top 25 vs. the Top 25: +51
YEAR TO DATE: $20.63 million, -9% vs. 2013
ALL TRADE PAPERBACK SALES
March 2014 versus one year ago this month: +18.31%
YEAR TO DATE: +1.39%
—
TOP 300 COMICS + TOP 300 TRADE PAPERBACK DOLLAR SALES
March 2014: $31.64 million
Versus 1 year ago this month: -9%
Versus 5 years ago this months: +13%
Versus 10 years ago this month, counting just the Top 100 TPBs: +15%
Versus 10 years ago this month, counting just the Top 25 TPBs: +56%
YEAR TO DATE: $88.64 million, -10% vs. 2013
ALL COMICS AND TRADE PAPERBACK SALES
March 2014 versus one year ago this month: -1.48%
YEAR TO DATE: -4.4%
—
OVERALL DIAMOND SALES (including all comics, trades, and magazines)
March 2014: approximately $40.73 million (subject to revision)
Versus 1 year ago this month: -1%
Versus 5 years ago this month: +31%
Versus 10 years ago this month: +36%
YEAR TO DATE: $116.59 million, -4% vs. 2013
The average comic book in the Top 300 cost $3.64; the average comic book retailers ordered cost $3.70. The median price for comics offered was $3.99, and the most common price for comics offered was also $3.99. Click to see comics prices across time.
So the market ends the quarter about $5 million off the pace of 2013, a not-unexpected place for it to be given the winter weather, the lack of major event titles, and the degree to which 2013′s volume was impacted by heavy discounting.
A reminder: Free Comic Book Day is May 3. And check the Comic Shop Locator Service to find a comic shop near you.
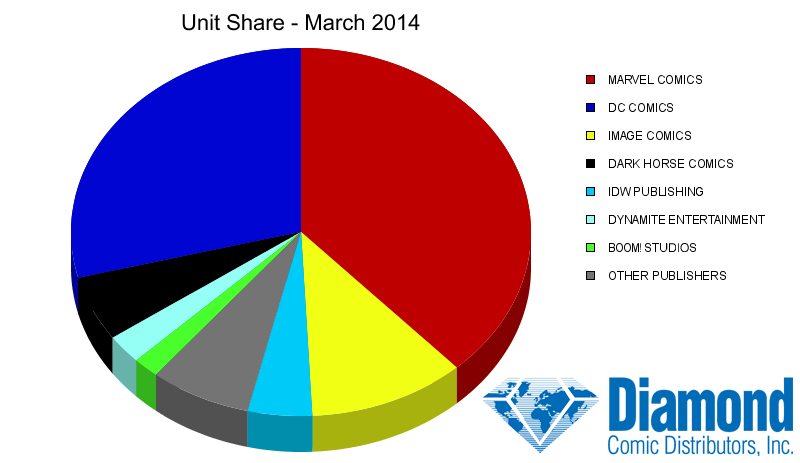
 Comics sales continued to look anemic in March, with sales down 4.40% in dollars and 9.85% in units over a year ago for year to date. The one positive number was graphic novel sales for the quarter, which were up from last year, although still down from Q4 ’2013. Batman once again led the periodicals, and Walking Dead led GN sales. Marvel held its share of units and dollars, while Image was up to double digits in both, with DC slipping a point or two.
Marvel had five of the month’s top ten best-selling comics, DC four and Image one — see if you can guess what it was. In GNs, it was more mixed with Image having four titles in the top ten—including the $60 Stray Bullets Uber Alles edition—and Dark Horse and Boom! charting with Avatar: The Last Airbender Volume 7: Rift Part 1 and the third Adventure Time OGN Seeing Red.
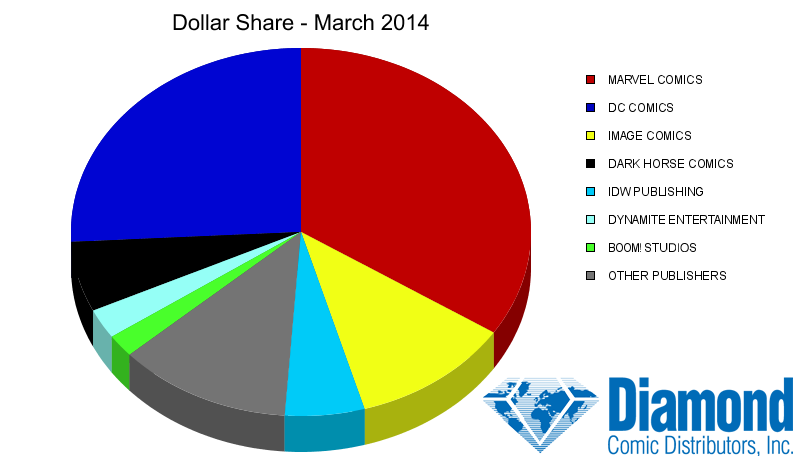
TOP COMIC BOOK PUBLISHERS
|
PUBLISHER
|
DOLLAR
SHARE
|
UNIT
SHARE
|
| MARVEL COMICS |
34.31%
|
38.17%
|
| DC COMICS |
25.94%
|
29.02%
|
| IMAGE COMICS |
11.38%
|
11.04%
|
| DARK HORSE COMICS |
6.19%
|
5.72%
|
| IDW PUBLISHING |
5.29%
|
4.51%
|
| DYNAMITE ENTERTAINMENT |
2.61%
|
2.56%
|
| BOOM! STUDIOS |
1.99%
|
1.84%
|
| EAGLEMOSS PUBLICATIONS |
1.59%
|
0.35%
|
| AVATAR PRESS |
1.14%
|
0.94%
|
| RANDOM HOUSE |
1.04%
|
0.26%
|
| OTHER NON-TOP 10 |
8.53%
|
5.59%
|
NEW TITLES SHIPPED
|
PUBLISHER
|
COMICS SHIPPED
|
GRAPHIC NOVELS SHIPPED
|
MAGAZINES SHIPPED
|
TOTAL
SHIPPED
|
| DC COMICS |
84
|
28
|
1
|
113
|
| MARVEL COMICS |
75
|
34
|
0
|
109
|
| IMAGE COMICS |
54
|
13
|
0
|
67
|
| IDW PUBLISHING |
42
|
22
|
0
|
64
|
| DARK HORSE COMICS |
42
|
15
|
0
|
57
|
| DYNAMITE ENTERTAINMENT |
34
|
5
|
0
|
39
|
| BOOM! STUDIOS |
28
|
7
|
0
|
35
|
| AVATAR PRESS |
11
|
4
|
0
|
15
|
| RANDOM HOUSE |
0
|
15
|
0
|
15
|
| EAGLEMOSS |
0
|
0
|
12
|
12
|
| OTHER |
63
|
104
|
16
|
183
|
COMPARATIVE SALES STATISTICS
|
|
DOLLARS
|
UNITS
|
|
MARCH 2014 VS. FEBRUARY 2014
|
| COMICS |
4.11%
|
6.32%
|
| GRAPHIC NOVELS |
24.00%
|
25.00%
|
| TOTAL COMICS/GN |
10.22%
|
7.93%
|
|
MARCH 2014 VS. MARCH 2013
|
| COMICS |
-9.47%
|
-11.83%
|
| GRAPHIC NOVELS |
18.31%
|
22.85%
|
| TOTAL COMICS/GN |
-1.48%
|
-9.28%
|
|
FIRST QUARTER 2014 VS. FOURTH QUARTER 2013
|
| COMICS |
-14.30%
|
-13.77%
|
| GRAPHIC NOVELS |
-11.59%
|
-1.59%
|
| TOTAL COMICS/GN |
-13.45%
|
-12.82%
|
|
FIRST QUARTER 2014 VS. FIRST QUARTER 2013
|
| COMICS |
-6.89%
|
-11.40%
|
| GRAPHIC NOVELS |
1.39%
|
10.06%
|
| TOTAL COMICS/GN |
-4.40%
|
-9.85%
|
|
YEAR-TO-DATE 2014 VS. YEAR-TO-DATE 2013
|
| COMICS |
-6.89%
|
-11.40%
|
| GRAPHIC NOVELS |
1.39%
|
10.06%
|
| TOTAL COMICS/GN |
-4.40%
|
-9.85%
|
TOP 10 COMIC BOOKS
|
RANK
|
DESCRIPTION
|
PRICE
|
ITEM CODE
|
VENDOR
|
|
1
|
BATMAN #29 |
$4.99
|
JAN140290-M |
DC |
|
2
|
SUPERMAN UNCHAINED #6 |
$3.99
|
OCT130160-M |
DC |
|
3
|
FOREVER EVIL #6 |
$3.99
|
DEC130197-M |
DC |
|
4
|
SANDMAN OVERTURE #2 (MR) |
$3.99
|
DEC130330-M |
DC |
|
5
|
SUPERIOR SPIDER-MAN #29 |
$3.99
|
JAN140720-M |
MAR |
|
6
|
DAREDEVIL #1 |
$3.99
|
JAN140630-M |
MAR |
|
7
|
SUPERIOR SPIDER-MAN #30 |
$3.99
|
JAN140722 |
MAR |
|
8
|
SILVER SURFER #1 |
$3.99
|
JAN140650-M |
MAR |
|
9
|
THE WALKING DEAD #124 (MR) |
$2.99
|
JAN140624 |
IMA |
|
10
|
UNCANNY X-MEN #19.NOW |
$3.99
|
JAN140665-M |
MAR |
TOP 10 GRAPHIC NOVELS & TRADE PAPERBACKS
|
RANK
|
DESCRIPTION
|
PRICE
|
ITEM CODE
|
VENDOR
|
|
1
|
THE WALKING DEAD VOL. 20: ALL OUT WAR PART 1 TP (MR) |
$14.99
|
JAN140559 |
IMA |
|
2
|
SAGA VOLUME 3 TP (MR) |
$14.99
|
JAN140556 |
IMA |
|
3
|
NEMO: ROSES OF BERLIN HC (MR) |
$14.95
|
JAN141334 |
TOP |
|
4
|
AVATAR: THE LAST AIRBENDER VOL. 7: RIFT PART 1 TP |
$10.99
|
NOV130064 |
DAR |
|
5
|
CHEW VOLUME 8: FAMILY RECIPES TP (MR) |
$12.99
|
JAN140548 |
IMA |
|
6
|
JUSTICE LEAGUE: TRINITY WAR HC (N52) |
$29.99
|
NOV130226 |
DC |
|
7
|
HARLEY QUINN: WELCOME TO METROPOLIS TP |
$19.99
|
DEC130313 |
DC |
|
8
|
ADVENTURE TIME VOL. 3: SEEING RED OGN |
$11.99
|
JAN141027 |
BOO |
|
9
|
MARVEL MASTERWORKS: AMAZING SPIDER-MAN VOL. 1 TP |
$24.99
|
NOV082434 |
MAR |
|
10
|
STRAY BULLETS UBER ALLES EDITION TP (MR) |
$59.99
|
JAN140530 |
IMA |
TOP 10 BOOKS
|
RANK
|
DESCRIPTION
|
PRICE
|
ITEM CODE
|
VENDOR
|
|
1
|
DOCTOR WHO: 11TH DOCTOR SONIC SCREWDRIVER KIT |
$12.95
|
JAN141487 |
RUN |
|
2
|
WILLIAM SHAKESPEARE’S THE EMPIRE STRIKETH BACK HC |
$14.95
|
JAN141522 |
RAN |
|
3
|
PAUL POPE’S MONSTERS & TITANS: BATTLING BOY ART ON TOUR SC |
$24.99
|
JAN140554 |
IMA |
|
4
|
LEGEND OF ZELDA: HYRULE HISTORIA HC |
$34.99
|
SEP120055 |
DAR |
|
5
|
THE SHADOW DOUBLE NOVEL VOLUME 82: SPY RING SC |
$14.95
|
JAN141518 |
SAN |
|
6
|
HATSUNE MIKU GRAPHICS VOCALOID VOLUME 1 SC |
$34.99
|
AUG131474 |
UDO |
|
7
|
DOC SAVAGE DOUBLE NOVEL VOLUME 73: LAND OF LONG JUJU SC |
$14.95
|
JAN141517 |
SAN |
|
8
|
BATMAN SCIENCE: THE REAL WORLD SCIENCE BEHIND BATMAN’S GEAR SC |
$9.95
|
NOV131374 |
CAP |
|
9
|
DRAGON’S DOGMA OFFICIAL DESIGN WORKS SC |
$44.99
|
AUG131471 |
UDO |
|
10
|
ADVENTURE TIME: TOTALLY MATH POSTER COLLECTION SC |
$19.95
|
JAN141468 |
ABR |
TOP 10 TOYS
|
RANK
|
DESCRIPTION
|
ITEM CODE
|
VENDOR
|
|
1
|
THE WALKING DEAD TV SERIES 5 ACTION FIGURES |
JUL138243 |
TMP |
|
2
|
BATMAN HUSH: BATMAN & CATWOMAN KISS STATUE |
SEP130322 |
DC |
|
3
|
ARROW: OLIVER QUEEN/DEATHSTROKE ACTION FIGURE 2-PACK |
NOV130293 |
DC |
|
4
|
DC COMICS COVER GIRLS HUNTRESS STATUE |
OCT130308 |
DC |
|
5
|
BATMAN ARKHAM CITY: TWO-FACE ACTION FIGURE |
NOV130290 |
DC |
|
6
|
BATMAN BLACK & WHITE STATUE BY GARY FRANK |
OCT130310 |
DC |
|
7
|
WONDER WOMAN ART OF WAR STATUE BY JIM LEE |
SEP130317 |
DC |
|
8
|
SUPERMAN: MAN OF STEEL STATUE BY ROCAFORT |
OCT130309 |
DC |
|
9
|
DC COMICS SUPER VILLAINS: OWLMAN ACTION FIGURE |
OCT130307 |
DC |
|
10
|
DC COMICS SUPERGIRL “NEW 52″ ARTFX+ STATUE |
SEP132026 |
KOT |
TOP 10 GAMES
|
RANK
|
DESCRIPTION
|
ITEM CODE
|
VENDOR
|
|
1
|
MONOPOLY: THE WALKING DEAD SURVIVAL EDITION |
OCT128266 |
USA |
|
2
|
MARVEL HEROCLIX: CAPTAIN AMERICA: THE WINTER SOLDIER |
DEC132341 |
NEC |
|
3
|
DC HEROCLIX: LEGION OF SUPERHEROES BOOSTER BRICK |
OCT132418 |
NEC |
|
4
|
RISK LEGACY |
JUN118204 |
HAS |
|
5
|
MARVEL HEROCLIX: CAPTAIN AMERICA: THE WINTER SOLDIER STARTER SET |
DEC132343 |
NEC |
|
6
|
DC HEROCLIX: LEGION OF DOOM FAST FORCES 6-PACK |
OCT132416 |
NEC |
|
7
|
MAGIC THE GATHERING TCG: BORN OF THE GODS BOOSTER PACK |
DEC132337 |
WZK |
|
8
|
RISK: THE WALKING DEAD SURVIVAL EDITION |
OCT128267 |
USA |
|
9
|
MAGIC THE GATHERING TCG: BORN OF THE GODS FAT PACK |
DEC132339 |
WZK |
|
10
|
MAGIC THE GATHERING CCG: DUEL DECKS JACE VS. VRASKA |
JAN148058 |
WZK |
MIMS HOUSE: Great NonFiction for Common Core

The story of the oldest known wild bird in the world. At 62+, she hatched a new chick in February, 2013. Read her remarkable story. A biography in text and art.
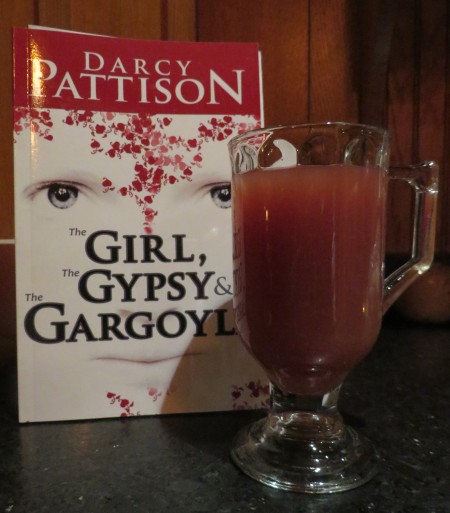
Here’s the cover of my new book that will be out in March 2014! Wahoo! Only 90 days or so till you can read it.
And for your pleasure, here’s the recipe for Cranberry Tea Punch that we always have during the holidays.
Cranberry Tea Punch
1 cup sugar
2 cups Pineapple
4 cups Cranberry Juice Cocktail
4 cups brewed tea (I use Luzianne Decaf)
Cinnamon stix, cloves.
I also like to float slices of lemon and orange.
Warm it up and have it close while you read a book.


[…] Tweet […]
Great news!
It’s amazing how graphic novels and collections have turned the corner. Not just in the height of sales, but in the continued longevity of sales data. I’m old enough to remember with the graphic novels were a footnote to the comic sales data back in the days of the Comic’s Buyer’s Guide.
And to think, all Image had to do to get back to their old market position was evolve into a completely different company.
To be fair, it should be noted that March 2014 also seemed to have a massive amount of deep discounting from Marvel, since I doubt retailers just spontaneously decided to order dozens of older Masterworks softcovers and other older books, some at levels higher than their original direct market orders. It didn’t inflate the market as much since these weren’t as expensive as the hardcovers offered for sale in other months. I do kind of wish Diamond had a separate chart for books offered at deep discounts, or at least marked them in some way, since they kind of clutter up the chart, and knock a few dozen other entries off the Top 300.
Every month has some, but it didn’t have nearly the dollar impact on the bottom line, as you say. I honestly don’t know how they should deal with this situation: the percentage changes and market shares have always been based on wholesale dollars, to keep things fair for the publishers. But a list sorted by wholesale dollar earnings (which is possible, sorting by dollar rank) just isn’t as easy to comprehend.
Looking again — yeah, there were 89 (!) Marvel hardcovers in the March 2013 top 300 list, versus something like nine this March. The difference at total retail was more than a million dollars.