new posts in all blogs
Viewing: Blog Posts Tagged with: infographics, Most Recent at Top [Help]
Results 51 - 75 of 162
How to use this Page
You are viewing the most recent posts tagged with the words: infographics in the JacketFlap blog reader. What is a tag? Think of a tag as a keyword or category label. Tags can both help you find posts on JacketFlap.com as well as provide an easy way for you to "remember" and classify posts for later recall. Try adding a tag yourself by clicking "Add a tag" below a post's header. Scroll down through the list of Recent Posts in the left column and click on a post title that sounds interesting. You can view all posts from a specific blog by clicking the Blog name in the right column, or you can click a 'More Posts from this Blog' link in any individual post.

By: Alice,
on 4/2/2015
Blog:
OUPblog
(
Login to Add to MyJacketFlap)
JacketFlap tags:
Infographics,
Internet dating,
*Featured,
emerging adulthood,
Psychology & Neuroscience,
generational attitude,
Jeffrey Jensen Arnett,
Winding Road from the Late Teens Through the Twenties,
Books,
love,
sex,
Add a tag
Attitudes towards love, sex, sexuality, and gender have changed rapidly over the last decade. What role do emerging adults play in this phenomenon? Are they really more open-minded than the previous generations -- or more at risk?
The post Love and sex: perspectives from emerging adults appeared first on OUPblog.
Images are similar to colors in that they can evoke emotions and even actions.
In an interesting article on eight types of images, at CopyBlogger, the author explains how each type has its own psychological influences.(1)
Before the types listed in the article are divulged, it’s important to know why images are so important.
According to Web Marketing Group, “Ninety percent of information that
By: Alice,
on 3/22/2015
Blog:
OUPblog
(
Login to Add to MyJacketFlap)
JacketFlap tags:
Journals,
Infographics,
infographic,
Social Sciences,
*Featured,
oxford journals,
Earth & Life Sciences,
Addis Ababa Ethiopia,
JEL,
Jonathan Chenoweth,
Journal of Environmental Law,
Kisumu Kenya,
Lorna Grace Okotto,
Mulugeta Ayalew,
Rosalind Malcolm,
safe drinking water,
Small Independent Water Providers,
Stephen Pedley,
water-supply,
World Water Day,
Yacob Mulugetta,
Law,
Add a tag
In order to build the future we want, we must consider the part that water plays in our ecosystems, urbanization, industry, energy, and agriculture. In recognition of this challenge, the United Nations celebrates World Water Day on 22 March each year, including this year’s theme: ‘Water and Sustainable Development’.
The post Independent water providers in Kisumu and Addis Ababa appeared first on OUPblog.
By: VictoriaD,
on 2/26/2015
Blog:
OUPblog
(
Login to Add to MyJacketFlap)
JacketFlap tags:
eating disorders,
body image,
bulimia nervosa,
Infographics,
National Eating Disorders Awareness Week,
purging,
infographic,
Binge Eating,
*Featured,
Online products,
Psychology & Neuroscience,
Oxford Clinical Psychology,
Add a tag
ore than 30 million people in the United States suffer from an eating disorder. In acknowledgement of National Eating Disorders Awareness Week, we’ve put together a detailed infographic with facts and statistics based on information from Oxford Clinical Psychology. Explore the infographic for a better understanding of what millions of Americans suffer through on a daily basis. For more information on eating disorders, such as bulimia nervosa, treatments for binge eating and purging, and the significance of body image, visit Oxford Clinical Psychology.
The post Understanding the psychology of eating disorders [infographic] appeared first on OUPblog.
By: Ella Sharp,
on 2/19/2015
Blog:
OUPblog
(
Login to Add to MyJacketFlap)
JacketFlap tags:
Books,
Infographics,
*Featured,
Psychology & Neuroscience,
Chinese Psychology,
Eastern Psychology,
Michael Harris Bond,
Oxford Handbook of Chinese Psychology,
Western Psychology,
Add a tag
With China’s continued emergence as an economic and political superpower, there is a growing need for those in the West to understand the distinct way in which the Chinese people view the mind and its study. Although Chinese philosophy is steeped in considerations of the nature of the mind, psychology as it is understood in the West was not a discipline practiced in China until its introduction in the 19th Century.
The post Chinese New Year and psychology [infographic] appeared first on OUPblog.
By: SoniaT,
on 2/12/2015
Blog:
OUPblog
(
Login to Add to MyJacketFlap)
JacketFlap tags:
Books,
Infographics,
Charles Darwin,
*Featured,
Earth & Life Sciences,
charles darwin evolution,
Curtis Johnson,
Darwin's Dice: The Idea of Chance in the Thought of Charles Darwin,
darwinian theory,
evolutionary theory,
natural selection chance,
theory of natural selection,
Add a tag
Charles Darwin’s theory of Natural Selection changed the way scientists understood our evolutionary past, and is a concept with which most people are quite familiar. One often overlooked element of Natural Selection, however, is the role that chance plays in guiding this process. In Darwin’s Dice: The Idea of Chance in the Thought of Charles Darwin, Curtis Johnson examines many of Darwin’s most significant writings through this lens. Celebrate Darwin Day by discovering the important role chance plays in Darwinian Theory.

Image Credit: “Evolution Schmevolution.” Photo by Brent Danley. CC by NC-SA 2.0 via Flickr.
The post Darwin’s dice [infographic] appeared first on OUPblog.

A well-timed, well-executed infographic is always welcome. An exquisitely designed one you didn’t know anyone needed and don’t know how anyone either dreamt up the idea or went on to execute it can sometimes make your day. This was the case with the By the book: What age did the greatest authors publish their most […]
By: SoniaT,
on 1/13/2015
Blog:
OUPblog
(
Login to Add to MyJacketFlap)
JacketFlap tags:
*Featured,
oxford dictionary of national biography,
oxford dnb,
Online products,
Biography,
christopher hitchens,
British,
amy winehouse,
elizabeth taylor,
odnb,
Infographics,
Add a tag
January 2015 sees the addition of 226 biographies to the Oxford Dictionary of National Biography, offering the lives of those who have played their part in shaping British history between the late 20th and early 21st century. The sectors and professions each of these individuals influenced range from medicine to film, including Nobel Prize and Oscar winners. Explore our infographic below as we highlight a selection of these new lives: some well-renowned, some lesser-known, yet all significant.

You can download both jpg and pdf versions of the infographic. To discover more about these lives, visit the Oxford DNB’s January update page.
The post British lives by the numbers appeared first on OUPblog.

 The team at EpicReads.com has created a calendar infographic called “365 Days of YA.” Follow this link to download a full-size edition of the image.
According to the EpicReads blog, this piece features “book recommendations for every season, month, week and day of 2015…Pull up your Goodreads add to shelves, Amazon wishlists and however else you track what you want to read, because your to-be-read pile is about to get WAY bigger. #SorryNotSorry”
(more…)
New Career Opportunities Daily: The best jobs in media.
 Printerinks.com has created an infographic exploring “Banned Books Though History,” which highlights famous banned books throughout history.
The graphic spans from The Bible to The Da Vinci Code, revealing where and when each of the books on the list was banned.
We’ve embedded the full infographic after the jump. (Via Electric Literature).
(more…)
New Career Opportunities Daily: The best jobs in media.
 What books did you enjoy reading this year? The BookBub team has created a new infographic with “the ultimate list” of “The Best Books of 2014” which features many popular titles including Colorless Tsukuru Tazaki and His Years of Pilgrimage by Haruki Murakami, Capital in the Twenty-First Century by Thomas Piketty, and Little Failure: A Memoir by Gary Shteyngart.
According to the BookBub blog, the data used for this project from “23 different Best of 2014 lists — from The Washington Post to Library Journal to Buzzfeed and more.” We’ve embedded the entire graphic below for you to explore further.
(more…)
New Career Opportunities Daily: The best jobs in media.
 How much sleep would you forgo for the sake of productivity? Brain Pickings blogger Maria Popova and illustrator Wendy MacNaughton partnered together to design the “Famous Writers’ Sleep Habits & Literary Productivity” visualization.
The image features thirty-seven writers including Colorless Tsukuru Tazaki and the Year of His Pilgrimage author Haruku Murakami, Revival author Stephen King, and Mrs. Dalloway author Virginia Woolf. Follow this link to view the full piece.
New Career Opportunities Daily: The best jobs in media.
 What fiction books do you typically like to recommend? Designer David McCandless created an infographic called “Novels Everyone Should Read” for his new book, Knowledge is Beautiful.
Some of the titles featured in this image include To Kill a Mockingbird by Harper Lee, Catch-22 by Joseph Heller, and Twilight by Stephenie Meyer. We’ve embedded the entire graphic below for you to explore further. (via The Huffington Post)
(more…)
New Career Opportunities Daily: The best jobs in media.
 The Austin Public Library has created an infographic called “Jane Austen with a Twist.”
This flowchart, which honors Austen’s 239th birthday, features 23 recommendations for books inspired by the stories of Jane Austen.
We’ve embedded the entire graphic after the jump for you to explore further. (via BookRiot.com) (more…)
New Career Opportunities Daily: The best jobs in media.

Who would you name as the world’s greatest storyteller? The team at Raconteur.net interviewed 500 authors, journalists, editors, students, media experts, and marketing professionals to try to uncover the answer to this question; the data was collected into an infographic.
The ones that made it into the top six include five British writers and one American horror master: William Shakespeare, J.K. Rowling, Roald Dahl, Charles Dickens, Neil Gaiman, and Stephen King. Follow this link to view the full infographic.
New Career Opportunities Daily: The best jobs in media.
 Data journalist Niall McCarthy has created an infographic which explores the current state of eBooks
Charted by Statista, McCarthy shared the infographic in a post on Forbes. Check it out: “Today, 23 percent of all male adults and 33 percent of all female adults in the United States read e-books. In fact, the global e-book industry is worth a whopping $8.5 billion.”
We’ve embedded the entire graphic after the jump for you to explore further. (more…)
New Career Opportunities Daily: The best jobs in media.
 Online reading community site BookLikes has created an infographic that explores the different types of readers out there called, “What Kind of Reader Are You?”
The graph categories the different personalities of readers. Check it out:
Book lovers have different personalities just like ordinary people. We find it hard to choose only one as it also depends on the book(s) we’re reading. For the most of the time we’ll go for a mix of Polygamist+Extrovert+Altruist. Some books, however, make us monogamist introverts. And a very very tiny percentage of titles change us into neurotic readers.
We’ve embedded the entire graphic after the jump.
(more…)
New Career Opportunities Daily: The best jobs in media.
 Looking for some Christmas-themed reads? NinjaEssays.com has created an infographic called “Best Christmas Books,” which includes a list of popular holiday books across genres including: children’s, fantasy, romance and crime.
Check it out:
From How the Grinch Stole Christmas to Agatha Christie’s The Adventure of the Christmas Pudding, there is something for each family member. If classics are your choice, then you’ll enjoy reading (and rereading) Little Women or The Nutcracker. If, on the other hand, you want to surprise someone with a suspense-creating mystery book, then you could never go wrong with Mary Higgins Clark! Don’t worry; there is something for romance lovers as well – Bring Me Home for Christmas will be a great comfort read in a cold night.
Follow this link to see the entire graphic.
New Career Opportunities Daily: The best jobs in media.
 Scholastic has created the “What Do Kids Want in Books?” infographic. The data was sourced from the research done for the “Kids & Family Reading Report: Fifth Edition.”
The full report will be published in January 2015. We’ve embedded the entire graphic after the jump for you to explore further.
(more…)
New Career Opportunities Daily: The best jobs in media.
Today is #GivingTuesday! Here’s a great description of #GivingTuesday:
We have a day for giving thanks. We have two for getting deals. Now, we have #GivingTuesday, a global day dedicated to giving back. On Tuesday, December 2, 2014, charities, families, businesses, community centers, and students around the world will come together for one common purpose: to celebrate generosity and to give.
It’s a simple idea. Just find a way for your family, your community, your company or your organization to come together to give something more. Then tell everyone you can about how you are giving. Join us and be a part of a global celebration of a new tradition of generosity.
I love, love, love the idea that Black Friday and Cyber Monday, which are about consumerism and competition, are now followed by a day that refocuses our attention on generosity, kindness, and community.
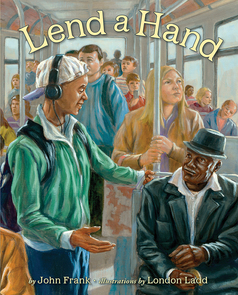
Our new picture book Lend a Hand: Poems About Giving is a collection of poems about different ways to help others, so in honor of #GivingTuesday, here’s a list of our favorite ways to lend a hand:
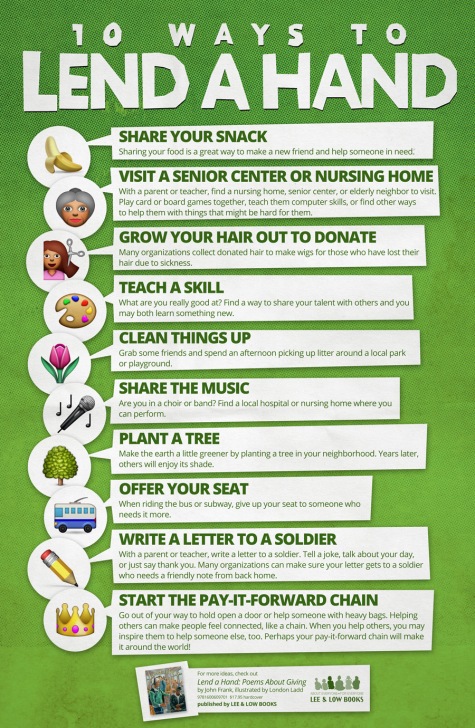
10 Ways to Lend a Hand (click for full-size image)
You can:
- Share Your Snack
- Visit a Senior Center or Nursing Home
- Grow Your Hair Out to Donate
- Teach a Skill
- Clean Things Up
- Share the Music
- Plant a Tree
- Offer Your Seat
- Write a Letter to a Soldier
- Start the Pay-It-Forward Chain
There are many different nonprofit organizations that have #GivingTuesday programs where your donation will be matched, and many more organizing volunteering outings tomorrow. Visit the #GivingTuesday website for lots of ways to participate. For more ideas about giving, check out Lend a Hand by John Frank, illustrated by London Ladd:
What’s your favorite way to lend a hand, on #GivingTuesday and every day?
Filed under:
Lee & Low Likes Tagged:
#givingtuesday,
infographics,
lend a hand 

 Have you ever made a bucket list for books? Gumtree.com has created an infographic called “12 Books You Should Read Before You Die.”
Some of the classic titles being featured include The Catcher in The Rye by J.D. Salinger, Of Mice and Men by John Steinbeck, and To Kill a Mockingbird by Harper Lee. We’ve embedded the entire graphic after the jump for you to explore further. (via The Mile Long Bookshelf)
(more…)
New Career Opportunities Daily: The best jobs in media.
 Have you ever wondered what books the heads of Amazon, Facebook, and Google read? CEO.com and DOMO partnered together to create an infographic called “The CEO Bookshelf.” This piece showcases the reading preferences of 22 high-profile entrepreneurs including Marissa Mayer, Elon Musk, and Larry Page.
Here’s more from CEO.com: “CEOs might be some of the hardest-working people in the business world, but the average chief executive still carves out a block of time every day to read. In fact, Warren Buffett admits to spending 80 percent of his day reading.” We’ve embedded the entire graphic after the jump for you to explore further.
(more…)
New Career Opportunities Daily: The best jobs in media.
By: Catherine Fehre,
on 11/25/2014
Blog:
OUPblog
(
Login to Add to MyJacketFlap)
JacketFlap tags:
Online products,
ebola crisis,
Arts & Humanities,
Rachel Fenwick,
Do They Know it's Christmas?,
Music,
History,
africa,
charity,
paul mccartney,
concerts,
bands,
Sting,
musicians,
This Day in History,
george michael,
david bowie,
Infographics,
band aid,
live aid,
cliff richard,
Phil Collins,
infographic,
*Featured,
who's who,
Add a tag
On this day in 1984, musical aficionados from the worlds of pop and rock came together to record the iconic ‘Do They Know It’s Christmas?’ single for Band Aid. The single has gone down in history as an example of the power of music to help right the wrongs in the world. The song leapt to the number one spot over the Christmas of 1984, selling over a million copies in under a week and totalling sales of three million by the end of that year. The Band Aid super-group featured the cream of eighties pop, including David Bowie, Phil Collins, George Michael, Sting, Cliff Richard and Paul McCartney.
The sales target for the single was £70,000, all of which was to be donated to the African famine relief fund. With support from Radio 1 DJs and a Top of the Pops Christmas Special, sales sky-rocketed and Geldof, feeling the strength of public opinion behind him, went toe-to-toe with the conservative government in an attempt to have tax on the single waived. Margaret Thatcher initially refused the plea, but as public outcry grew, Thatcher caved-in to public demands and the tax on sales worth nearly £9 million was donated back to charity.
Bob Geldof and a host of artists old and new have re-recorded the single to help raise funds to stem the Ebola crisis. Our infographic marks the 30th anniversary of the original recording and illustrates the movers and shakers that made this monumental milestone in pop history possible.

To view free articles examining the cause, the people, and the music, you can open the graphic as a PDF.
Headline image credit: Live Aid at JFK Stadium, Philadelphia, 1985. CC BY-SA 3.0 via Wikimedia Commons.
The post Band Aid (an infographic) appeared first on OUPblog.

 Earlier this week, the executives behind the Oxford Dictionaries announced that “vape” was chosen as the 2014 Word of the Year. With the popularity of electronic cigarettes (e-cigarettes) on the rise, usage of this word has increased.
Over at the OxfordWords blog, the team posted an infographic to share “the history of vape and why we’ve chosen it for Word of the Year – as well as looking at previous winners of Oxford Dictionaries’ Word of the Year over the past decade.” We’ve embedded the entire graphic after the jump for you to explore further.
(more…)
New Career Opportunities Daily: The best jobs in media.
 Do men read books written by female authors?
To answer this question, the Goodreads team examined the reading habits of 40,000 active members (20,000 men and 20,000 women). From there, the collected data was used to create an infographic called “Sex and Reading: A Look at Who’s Reading Whom.”
Here’s more from the Goodreads Blog: “This year the #readwomen movement inspired us to take a closer look at where readers fall along gender lines. There’s a lot of well-documented press about the fact that women’s books tend to have ‘girly’ covers instead of gender-neutral ones, and the VIDA count shows us that traditional book reviewers are predominantly male and books being reviewed in ‘top tier’ publications are mostly by men.” We’ve embedded the entire graphic after the jump for you to explore further.
(more…)
New Career Opportunities Daily: The best jobs in media.
View Next 25 Posts


