new posts in all blogs
Viewing: Blog Posts Tagged with: stats, Most Recent at Top [Help]
Results 1 - 25 of 33
How to use this Page
You are viewing the most recent posts tagged with the words: stats in the JacketFlap blog reader. What is a tag? Think of a tag as a keyword or category label. Tags can both help you find posts on JacketFlap.com as well as provide an easy way for you to "remember" and classify posts for later recall. Try adding a tag yourself by clicking "Add a tag" below a post's header. Scroll down through the list of Recent Posts in the left column and click on a post title that sounds interesting. You can view all posts from a specific blog by clicking the Blog name in the right column, or you can click a 'More Posts from this Blog' link in any individual post.
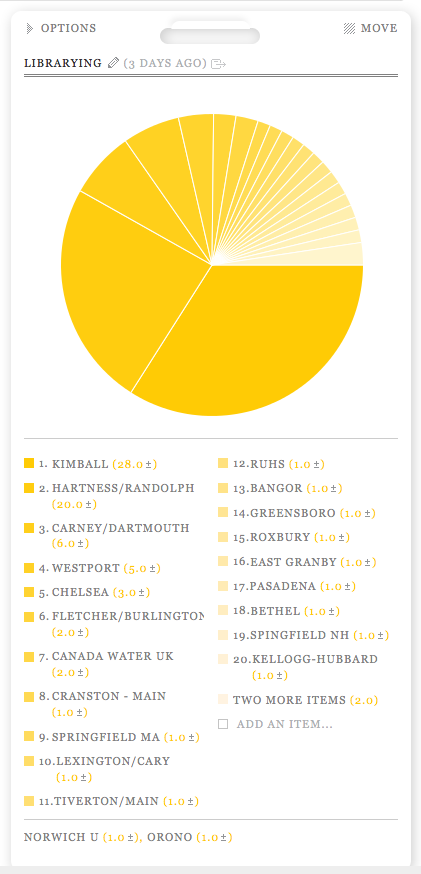
Again with the library tracking! This is now six years in a row. Previous years: 2014, 2013, 2012, 2011, 2010, 2009 and some reviews from 2003
I went to twenty-two different libraries in seven states and one non-US country for eighty-two visits total. Did not intend this but it’s the same number of visits (though many fewer individual libraries) as last year. A few things influenced this: I did a lot less distance traveling this year but did a lot of work in local libraries, I also taught at a college where the library was a major hangout for me (thanks VTC Librarians, you are the best) and I worked a lot at my local public library. Here’s the short annotated list of what I was doing in libraries last year.
- Kimball Library – my local public library, I work here and I am a patron here
- Hartness at VTC – the best academic library anywhere near here and I worked at VTC this year
- Carney Library UMass Dartmouth – probably my favorite library building of all time (still!)
- Chelsea VT – helping with tech planning and visiting my friend Virgil
- Westport MA – the library where I summer, trying to warm up to this library
- Fletcher/Burlington VT – did consulting here this year and spent more time here
- Canada Water UK – the closest public library to where my sister and I stayed in the UK, nice busy library
- Cranston RI – visiting my friend ed, great renovations!
- Springfield MA – did some work on the way to CT, neat building with a weird vibe
- Cary Library, Lexington MA – did a talk earlier in the year, really nice place and great people
- Tiverton RI Main Branch – lovely new building across from the Sip n Dip, great to see it!
- RUHS Library – high school library in my town
- Bangor ME – a neat classic library which is getting renovated
- Greensboro VT – the quintessential Vermont library
- Roxbury VT – taught an ipad class and saw how it’s been growing and changing
- East Granby CT – killing time bfore a CT talk, this was a great place to get some R&R
- Pasadena CA – there was a fancy event here for CLA and we had a nice time hanging out and talking to people in the theater.
- Bethel VT – another place I taught an iPad class
- Springfield NH – did some consulting for a library having growing pain challenges as they make decisions on whether to automate or not
- Kellogg-Hubbard VT – went to a slide show given by a friend of mine, great to be here again.
- Norwich University, Northfield VT – sropped by and saw their renovations and excellent art exhibits.
- Orono ME – a pretty and small library
The bigger deal was really the Passport to Vermont Libraries project, a summer program put on by VLA which got hundreds of Vermonters visiting their local libraries and getting passport stamps and other fun adventures. I worked on this with a team of a few other people and it was a very successful program and I think a chunk of that was all of our enthusiasm for our library visits. So I didn’t get my further in my personal project, but professionally I helped get this idea to take off. If you just like library photos, I have more on Flickr.

By: KatherineS,
on 10/23/2015
Blog:
OUPblog
(
Login to Add to MyJacketFlap)
JacketFlap tags:
puzzles,
algebra,
stats,
Mathematics,
disease,
expect,
Very Short Introductions,
DNA,
qualified,
maths,
witness,
*Featured,
obamacare,
Science & Medicine,
legal system,
maths puzzle,
Algebra VSI,
law court,
margin of error,
Peter M. Higgins,
probablity,
statistician,
Add a tag
A recent meme circulating on the internet mocked a US government programme (ObamaCare) saying that its introduction cost $360 million when there were only 317 million people in the entire country. It then posed the rhetorical question: "Why not just give everyone a million dollars instead?"
The post Why know any algebra? appeared first on OUPblog.

I tracked the libraries that I visited this year, like every year. Previous years: 2013, 2012, 2011, 2010 and 2009 (and this little list of reviews from 2003)
I went to thirty-six different libraries in seven states and two non-US countries for eighty visits total. A bunch more than last year, but some were just for ukulele practice or tech planning sessions at a friend’s library. Here’s the short annotated list of what I was doing in libraries last year. Top three libraries are: my local public, my local academic and my summer local.
- Kimball – my local and also the place that hosts Ukulele Club
- Hartness at VTC – the best academic library anywhere near here. Good hours, great place to hang out.
- Carney – UMass Dartmouth – probably my favorite library building of all time
- Chelsea VT – helping with tech planning, I go here often
- Somerville West – did a talk and stopped by here another time. Lovely upstairs.
- Goddard – did some VLA website work here
- Fairfield/Millicent – One of the most amazing looking libraries in MA with some cool local lore
- Aldrich/Barre – Went to a few meetings, my favorite local library renovation story
- Mackinac Island MI – small and lovely with a great book sale and classic furniture
- NYLP/SIBL – keep waiting for them to close this but they haven’t yet
- Southworth/Dartmouth – they have a harpoon display here!
- Pierson/Shelburne VT – went to a meeting, small with a great puzzle collection
- St Ignace MI – killing time while stranded here, this is a great building where you wouldn’t expect it
- Atwater/Montreal – my favorite Canadian library
- British Library – got an awesome tour from Stella Wisdom
- ULU Senate Hall UK – got a great tour from Simon who no longer works there
- Rockingham VT – dropped off some things, stuck around to take a peek at this great place
- Guilford UK – one of the smaller local publics, nice with a watch museum next door
- Roxbury VT – helped with the automation project
- Artizan St UK – community center, small and busy
- John Harvard Library UK – had an odd section for Black Titles and a security guard
- Sunderland MA – great place to pass the time en route to or from Amherst
- Somerville MA – the other little library
- Boxboro MA – wifi to check email if you are early to visit Mom
- Boston Public – got a great tour by Tom Blake and saw some great stuff
- Sun City AZ – hanging out while visiting Jim’s folks
- UM – Duluth – Chihuly sculpture!
- NYPL/Epiphany – I always love the huge staircase in here
- Duluth MI – bizarre design but fun to hang out in
- Westport MA – great DVD collection, sort of an odd place
- Barbican UK – inside the funky Barbican, lots of great UK history books
- Varnum, Cambridge VT – stopped by randomly, folks were so nice and friendly
- Ashfield MA – gave a talk, enjoyed getting to see the place
- NYPL/Kipp’s Bay – small and in need of renovation but warm and welcoming
- City University, UK – stopped to check email en route to dinner, nice place, square dancing outside
- Vicksburg MS – neat renovation, fun kids area
Did not get to as many Vermont libraries as I had wanted to as part of my 183 project. Working slowly on maybe getting a statewide 183 project up and running with other members of the VLA. Looking forward to another year of library visiting.

By: Kathy Temean,
on 7/26/2014
Blog:
Writing and Illustrating
(
Login to Add to MyJacketFlap)
JacketFlap tags:
2014 NJSCBWI Conference,
Agent Responses,
Editor Responses,
From State of the Market Report,
Future of Indy Book Stores,
Agent,
Editors,
stats,
Publishing Industry,
Book Stores,
Add a tag
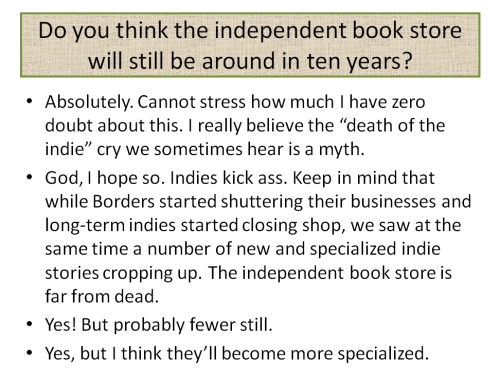
One of the questions I asked Editors and Agents was about the Indy Book Stores. Over the last year, I’ve heard so many writers and illustrators voice their concern about the stores future. We’ve seen some of our favorite book stores shut their doors and every publishing professional knows how lost we would be without them out there to help promote our books, so I had to ask.
First slide responses from editors:
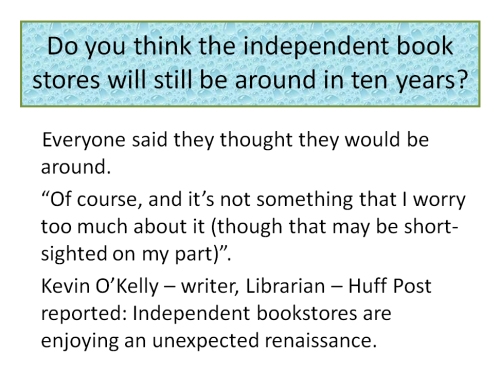
Second slide shows agent responses.
Talk tomorrow,
Kathy
Filed under:
Agent,
Book Stores,
Editors,
Publishing Industry,
stats Tagged:
2014 NJSCBWI Conference,
Agent Responses,
Editor Responses,
From State of the Market Report,
Future of Indy Book Stores 

Whether you're a spreadsheet enthusiast or allergic to numbers, digging into your site's stats can help you better engage with your audience. Let's take a look at three stats that can make a difference beyond page views.
By:
Liz Carmichael,
on 4/2/2014
Blog:
Liz Carmichael's Portal
(
Login to Add to MyJacketFlap)
JacketFlap tags:
Automattic,
WordPress.com,
hot list,
Device preview,
Community,
statistics,
Stats,
Themes,
Emoticons,
Add a tag
Another month is in the books! The WordPress.com community made March a month to remember with an avalanche of great achievements. Here's a look at some of the highlights.
I really need to upgrade this version of WordPress but I only remember when I am making a post and so I am busy. I did take the time, with other VLA members (Heidi! Helen! Sarah!) of redesigning the Vermont Library Association website. It was a great project, still a little bit in process, but I learned a lot more about responsive design and working with a team of engaged and interested people. Last weekend I went to Lexington MA to speak at the Cary Public Library. Not my usual routine, I was a guest speaker at a brunch talking about blogs. No slides, just talking. I talked about the history of this blog–15 years old this month–and other things I’ve done as a blogger. It went well. You can read the talk here: Blogs, Blogging and Bloggers. Scroll to the end to read a list of good book/reading blogs I put together. Ah, blogs!
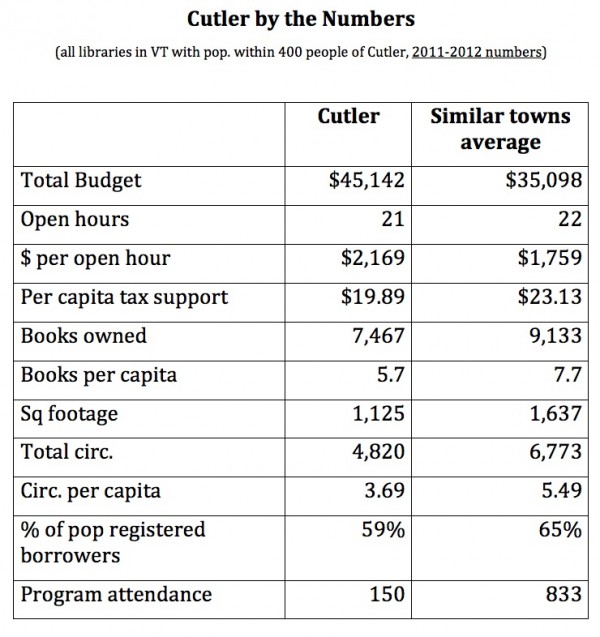
This past weekend I went to a strategic planning retreat for one of the local small public libraries. They are in the unenviable position of needing to make some changes without really having the cash or the staffing to do those changes. The head of the board asked if I’d come in and talk about… making tough decsions, what other libraries are doing, that sort of thing. I came in to talk a little bit about Libraries I Have Known and spent about 45 minutes with a combination of local library anecdotes (I got a million of ‘em) and some data-driven talk.
The Vermont Department of Libraries puts out a terrific Giant Spreadsheet every year with a lot of information about all of Vermont’s libraries. I’ve talked about it before. However, it’s more data than most people want to deal with, which is perfectly okay. I took the giant spreadsheet and used some Excel filtering and added some averages and summaries and was able to create a much more modest spreadsheet which basically said “Show us how we’re doing compared to other libraries our size” For this project, I took all the libraries that had within 400 people population-wise and found the most salient information about those libraries (budget, circ, per capita funding, programming &c.) and then highlighted where this library fell on the matrix for these values. It didn’t take long, but it was fiddly work. At the end of it I think I had a really useful one-sheet for the board (above) and a few smaller spreadsheets so they could see where the numbers came from. It was fun. I’d love to do it for more libraries. I work in-state for pizza and Fresca (and mileage if I have to schlep someplace). Look me up.
After a red-hot August of publishing news and impressive numbers, we wondered what was next for the WordPress.com community. Here’s a snapshot of September: You blew up the internet. Again. Month after month, we’re blown away by what you publish. Talk show host Matt Walsh‘s post, “Dear parents, you need …
By: Kathy Temean,
on 7/18/2012
Blog:
Writing and Illustrating
(
Login to Add to MyJacketFlap)
JacketFlap tags:
Publishers Marketplace,
need to know,
Children's Book Sales,
BookStats,
News,
Adult Fiction,
stats,
ebooks,
Publishing Industry,
Book Stores,
Add a tag
Yesterday Publisher’s Marketplace released a detailed report on Industry books sales collected by BookStats. Below are the things I thought you would be interested in reading:
Children’s and YA adult books comprised the “fastest-growing category” in 2011. Sales of $2.78 billion were up 12 percent from $2.48 billion in 2010, reflecting in part the boost from the success of The Hunger Games.
eBooks vaulted to the largest-selling format for adult fiction, comprising 31 percent of dollar sales. Adult fiction ebooks went from $585 million in 2010 to $1.27 billion in 2011.
Brick-and-mortar bookstores remain the single largest retail channel, though these sales fell 12.6 percent following the bankruptcy of Borders.
“Trade” Books (with Religion)
2011 2010
Overall $13.97 billion $13.9 billion
Print $11.1 billion
eBooks $2.074 billion $878 million
Other $796 million
Trade Books (without Religion)
2011 2010
Overall $12.517 billion $12.59 billion
eBooks $1.97 billion $838 million
Adult Fiction
Overall: $4.11 billion
eBooks: $1.27 billion
Print books: $2.84 billion
Children’s/YA Books
2011: $2.78 billion
2010: $2.48 billion
All Publishing
Sales
2011: $27.2 billion
2010: $27.9 billion
Channel Breakouts
Brick-and-mortar bookstores: $8.59 billion (-12.6%)
Institutional sales (libraries, schools, business, government, etc.): $5.39 billion
Online retail: $5.04 billion (+35%)
Wholesale/jobbers: $5.04 billion
Direct-to-consumer: $1.11 billion
A full report and/or a complete electronic dashboard, can be purchased from the BookStats site www.bookstats.org/ for release shortly.
Talk tomorrow,
Kathy
Filed under:
Book Stores,
need to know,
News,
Publishing Industry,
stats Tagged:
Adult Fiction,
BookStats,
Children's Book Sales,
ebooks,
Publishers Marketplace 

“We are pleased to release the first annual Illustrator Income Survey; this 88-page book details the incomes of 616 illustrators from all over the world. Easy-to-read charts and graphs detail income information by country, age and gender.”
- 
3x3, THE MAGAZINE OF CONTEMPORARY ILLUSTRATION: Illustrator Income Book Now Available ($30 for a hard copy at Blurb, or $5 for a downloadable PDF)
You may be interested in knowing that one illustrator somewhere in the US banked $980,000 last year.

Surveys showed then that “the percentage of female YA fans between the ages of 25 and 44 has nearly doubled in the past four years,” and “today, nearly one in five 35- to 44-year olds say they most frequently buy YA books. For themselves.”
http://www.inthelibrarywiththeleadpipe.org/2011/are-you-reading-ya-lit-you-should-be
http://online.wsj.com/article/SB10001424052702303657404576357622592697038.html
o ALA’s Newbery Medal is given to books written for readers up to fourteen years old, but its Michael L. Printz Award goes to books aimed at readers who are twelve to eighteen. In 1996, after more than a decade of dormancy, a National Book Award category for young people’s literature was resurrected. This award isn’t just for YA lit (it can go to titles for a younger audience or to non-fiction), but the YA lit titles to which it is awarded are of the highest literary merit.
o The Boston Globe-Horn Book Awards are a prestigious award in youth literature. They have a fiction and poetry category that recognizes winners as well as up to two honor books.
o The Michael L. Printz Award has been administered by the American Library Association since 2000 and recognizes winners and honor books that “exemplify literary excellence in young adult literature.”
Talk tomorrow,
Kathy
Filed under:
article,
awards,
News,
stats Tagged:
Adults reaading YA,
Awards,
Young Adult Books 


“Today, the marriage rate among librarians is the highest it has ever been with 62 percent of librarians married in 2009.”
There is a lot of data in the world. Librarians are good at using census data to help people find families, get local information and just learn something about the way the world used to be. Here’s a neat post about using hte census data from the last 120 years to learn something about librarianship as a profession. Did you know that the number of self-reported librarians peaked in 1990 and has declined almost 30% since then? I am somewhat curious if this is just because people with library and information science backgrounds are calling themselves all manner of things now [Is a taxonomist a librarian? How about a metadata specialist?]. You can read the full post, with graphs, over at Oxford University Press’s Social explorer.
 Many of you have asked to hear the stats from the conference. Here they are:
We had 299 people attend. That is everyone, including the editors and agents.
We had 354 critiques, portfolio reviews, and special consultations.
Attendees came from 23 different states.
One Hundred and Thirty-Nine people received pitches and 142 people attended a First Page Session.
Fifty-six people attended the First -Timers Session and from the feedback, everyone who attended got a lot out of the session and it helped break the ice for people who did not know anyone.
One Hundred and forty-seven attendees came to the Mix and Mingle on Friday night. We had a long line for the food this year, but we have already talked to the hotel about how to correct the situation.
Below are places where we spent a huge amount of time and still made mistakes.
 Every year, we try to put attendees with different editors and agents where possible. Example: You had one-on-one critiques with Mr./Ms. agent and Mr./Ms. editor, and you signed up for a first page (which we put you with two other editors), then if you had a pitch we aimed to get you with an agent that you hadn’t seen and then we tried to put you at lunch on Saturday and Sunday with two other editor/agents that you weren’t on your scheduled. This was a nightmare. I think we did a pretty good job in getting the job done, but there were a few mistakes and people complained that they were scheduled for a pitch with an agent that didn’t do what they wrote.
So we have decided that next year, we are going to do things differently. We are planning to have an online registration, where you will pick your lunch tables both days and you will pick the First Page sessions you want to attend, along with the workshops. When it is sold out, it is sold out and you will have to look for the next best thing. So people who sign up later, will not have everything to chose from. Also people who decide at the last minute they have to leave the conference early will not have all options open to them. It is not a simple task to move someone when there is a huge web of critiques, pitches and first page sessions. We did our best, but last minute changes is like turning a hose directly on a spider web – the whole thing can collapse. Trying to do these types of changes two days before the conference causes a mess and an awful lot of stress. We are looking for ways to avoid the stress and hope by pointing that out, people will try to do better on their side of things.
 Next year we plan to have editors and agents come in earlier on Friday, so you will be able to choose to do critiques on Friday. This way more people can be scheduled for their critiques when workshops are not in session. Of course, we will still need to have some attendees do critiques during worksho
I had fun collecting stats on my sidebar polls last week. Thanks to all 1,453 of you who answered the questions!
Turns out:
→ 93% of you are writers
→ 85% of you are writing fiction
→ 73% of you are not yet published
→ 77% of you are writing for the general (not Christian) market
By far the most interesting info I gathered was the genres my blog readers are writing (or at least those who chose to vote). Here's how it stacked up:
26% Fantasy or sci-fi
21% General/other (non-genre fiction)
12% Women’s fiction
12% Mystery/suspense
10% Supernatural or paranormal
9% Romance
7% Historical (romance or not)
I was particularly interested in the fact that the largest percentage was fantasy and sci-fi. I don't typically rep fantasy or sci-fi, so I really appreciate all of you reading my blog!
When the numbers first started coming in, I immediately noticed the large percentage who checked fantasy/sci-fi, and I wondered whether there might be a disproportionate number of
writers in that genre vs.
readers (hence the difficulty many of you are having getting published). I set out to try and run the numbers, but it's ridiculously hard to find accurate data on book sales
by genre. So I went about it a different way. I decided to look at recent book
deals as listed on Publishers Marketplace.
I chose two months: April, 2011, and October, 2010, and looked at all the fiction deals reported. There were 309 total deals. Here is how they stacked up by genre:
38% General/other (non-genre fiction)
30% Women’s/Romance
11% Thriller
10% Mystery/Crime
6% Sci-fi/Fantasy
5% Paranormal
<1% Horror
I realize this isn't scientific, it's strictly anecdotal. But the anecdotal evidence supports the initial instinct I had when I saw the numbers. While 26% of those voting report writing fantasy or sci-fi, sampling from two recent months suggests only 6% of book deals were done in those genres. That's not a minor discrepancy...it's a significant difference.
What do you make of this? What other conclusions might you draw from these two lists of (unscientific) statistics?© 2011 Rachelle Gardner, Literary Agent
By: Lauren,
on 3/31/2011
Blog:
OUPblog
(
Login to Add to MyJacketFlap)
JacketFlap tags:
Sports,
baseball,
statistics,
stats,
Mathematics,
mlb,
wizard,
yankees,
spring training,
*Featured,
fielders,
gold glove,
michael humphreys,
Omar Vizquel,
shortstop,
Tom Tango,
who is the best shortstop,
wizardry,
vizquel,
play—fielding,
shortstops,
assists,
fielder,
humphreys,
fielding,
Add a tag
By Michael Humphreys
Baseball fans love to compare the players of today to the players who came before, but one must wonder how great the margin of error in these comparisons is. Is there any way of knowing who the real baseball greats are, and whose legend should stand the test of time?
Let’s take Omar Vizquel as an example. So says Wikipedia, “Vizquel is considered one of baseball’s all-time best fielding shortstops.” It’s true, Vizquel “is considered” a great fielder. Of shortstops, he
-holds the highest career fielding percentage of those with a long career.
-has participated in more double plays (and his primary double play partner just entered the Hall of Fame)
-is third in career assists
-has played more games at shortstop than anyone in major league history.
On top of all that, Vizquel has received more Gold Gloves than any other shortstop except for Ozzie “Wizard of Oz” Smith. Indeed, writers have described Omar and Ozzie as the “graceful Fred Astaire” and “acrobatic Gene Kelly,” respectively, of shortstops.
Vizquel has something of a signature play—fielding ordinary grounders (not just bunts) with his bare hand and throwing in one motion. He was the starting shortstop for the most successful American League team of the 1990s, second only to the Yankees. He hasn’t been much of a hitter, even for a shortstop, so it’s not unreasonable to infer he must have been a great fielder to hang on as long as he has.
But, after all that, how do we really Vizquel actually is one of baseball’s all-time best fielding shortstops? With metrics.
Let’s start with the question: What is the job of a fielder? To help his team prevent runs. At shortstop, this mainly involves converting ground balls into outs and getting the second out on double plays—in other words, recording assists. (It is very rare that shortstops catch fly balls or pop ups that couldn’t be fielded by at least two and as many as five other fielders. Most of the differences in putout rates for shortstops reflect how much they ‘hog’ these easy chances, not how many marginal hits they help their teams prevent. And line drive putouts at short are mostly dumb-luck plays.)
It is not the job of a shortstop (or any fielder) to look “graceful” or make trick plays. It’s not even a fielder’s job to avoid errors. In fact, a fielder who makes ten more successful plays but also ten more errors has just the same value as the fielder who makes an average number of plays and errors, because an error is no worse than a play not made.
Any fielding metric for shortstop needs to estimate how many assists a shortstop generated above or below what an average shortstop would have, playing for the same team. My system uses some arithmetic and the statistical technique of “regression analysis,” resulting in what I call Defensive Regression Analysis, or DRA.
DRA estimates the number of assists the league average shortstop would have recorded in place of the shortstop you’re rating by starting with the average number of shortstop assists per team that year and adjusting that number up or down based on statistically significant relationships between shortstop assists and other defensive statistics of the player’s team that are
1. not influenced by the shortstop himself,
2. as little influenced by the fielding quality of his teammates as possible, and
3. independent (approximately) of each ot
Those of you who've met me in person know: I can have a little bit of a... uhm... potty mouth? I blame my husband, who cusses ten times more than I do. I've been working on being more of a lady, with some days being better than others.
I thought this was an interesting article (Flavorwire) on the most popular cuss words among kids. It looks at both U.K. and U.S. trends. Not much has changed, with the f-bomb still popular as ever. One interesting thing: British boys cuss twice as much as girls, where in the U.S., they're about equal in their exclamation of dirty words.
There's gender equality yet!
There's an interesting article over at Publishers Weekly, tallying up children's book sales for 2010. The big winners: series--no surprise there. E-books are winning too, again not surprising.
Read the whole thing here.
And happy weekend, all!!
Hi all. I know it's mid-January already, so I'm delinquent. Again. But I've finally compiled my stats for queries received in November and December. I'll do them month by month as not to muddle the numbers.
Trends:
- Numbers were down overall these two months. I feel like November makes sense because of National Novel Writing Month. And then December took a dive at the end when the holidays hit--which I think is 100% okay with me. I'd much prefer that that a sharp spike with novels that were just finished and not ready for prime time. Plus, we're all lazy around the holidays.
- I am seeing lots and lots of dystopians again. I know it's in the water. I've sold 4 of them already. So it's not that I don't love them when I turn them down...it's just that it's crowded.
- In spite of stating quite clearly that I don't rep picture book manuscripts and you must be the illustrator also, I am getting quite a few queries to that effect anyway.
But here are the numbers...
November:
- Total: 204
- Requested: 5
- Categories of Requested: 4 YA (2 contemporary, 1 dystopian, 1 sci-fi) and 1 MG (historical/comedy)
December:
- Total: 175
- Requested: 1
- Categories of Requested: contemporary YA
So...I'm leaving the numbers simpler this month. Not going to get into funny numbers with weird stats. Obviously, these two months combined were about what I get in an average month the rest of the year. So take all that for what it's worth. I've been seeing more strong YA than middle grade, and don't really know what that's about.
But...onward into January!
And in case you missed it, I need an intern. Send them to this link here!
The 42nd Annual Coretta Scott King Book Awards were announced this week. The awards are for outstanding books for children and young adults by an African American author. The annual illustrator award was added in 1974. A Lifetime Achievement award was added in 2010. Congratulations to all nine 2011 recipients!Since 2008, I've kept a spreadsheet on each year's winners. Simple items: year, what
My submission holiday paid off. I have been able to start from Query Inbox Zero and stay caught up. I'm now answering all queries within a week. Hooray! So I'm sure everyone's curious how my October queries went over. Did I get a bunch of good stuff? Or did I just get all the stuff that had already been passed on while I was closed? Who knows, really.
- Total: 337
- Requested: 6
- Categories of Requested: 5 YA (2 contemporary, 1 fantasy, 1 dystopian, 1 historical), 1 MG (sci-fi)
- Queries with attachments: 7
- Queries with a book cover: 1
I think I requested all of those manuscripts in the first week. It was down hill from there. Otherwise of note in the pile this month is that I'm still getting just lots of queries for genres that I don't represent. Lots of memoir, a good chunk of adult fiction, and MANY picture books from authors-only. If you're not an author-illustrator, then I'm sorry, but I'm not interested.
I can't stress enough the need to research your agents. Interestingly, this was also the month I got a very unpleasant phone-call from a man who runs an agency research site, where he charges users for information I give away freely and then accuses me of being a crook because I don't want my phone number listed. Go figure.
But please, research. I update my info on this site regularly. I post my deals on Publisher's Marketplace, and we have an agency page there. I just checked AgentQuery.com. Everything is good there. I still can't control my information on querytracker.net, and have to request changes when I find errors (which there always are), but whatever. So where the bad information comes from? Who knows. Tips are welcome.
Keep the queries coming though. I'm on the hunt for good stuff! Just really great middle-grade and YA with concepts that really pop, and a fresh voice in pretty much anything. Try me!

It’s been a while. Life and other endeavors have gotten in the way and blogging has fallen far down the list of priorities. My blog ranking has suffered because of it. According to Alexa.com, this is no longer one of the top million web sites in the world. Michelin has taken away one of my three stars.
A friend once told me he hopes that upon death, we will all receive a stat sheet, detailing our minor accomplishments. Miles walked. Daves known. Cumulative hours spent listening to Al Jarreau. The sheet will also feature our all-time world rankings. Have I eaten more buffalo wings than Alexander the Great? Hit more three pointers than Charles Nelson Reilly? Important knowledge for a man to take into the afterlife.
One thing is for sure. Every person is bound to be the best in history at least one thing, though most of us probably wouldn’t know what that thing is.
“Congratulations, my friend, you have spent more time doing annoying, and inaccurate, Austin Powers impressions than any other human in history.
“Fine. Guilty. Just give me a trophy and let me in, St. Pete.”
“Do it first.”
“Come on. I just want to sit on a cloud and flirt with Joan of Arc.”
“Do. It.”
“Fine. Groovin’ Baby. Groovin’.”
It embarrasses me to tell you this, but one of the important things I’ve been doing instead of blogging is playing Rock Band. Thanks to Craig and is eponymous list, I picked up a full set for a cool $30. For that price, I’d be a fool not to try to master Mountain’s Mississippi Queen on a plastic push-button Fender!
One thing I learned from my foray into Rock Band is that I’m not very good at video games. I used to be okay, back in the days when Kid Icarus was the rage. But I haven’t played many video games as an adult, and I certainly lack the inspiring dedication some of my peers possess.
I remember one lazy summer Saturday a few years back when I turned on the TV and I saw a Guitar Hero competition. On ESPN. With adults involved. All varieties of nerd were collected on stage and they were playing Metallica and, I don’t know, Molly Hatchet or something. They were mugging and fist pumping and throwing the devil horns out to the crowd. All the while their fingers were racing across video game frets like Bishop’s knife trick. They didn’t miss a note.
All I could think was: Good gravy! If these guys dedicated their time to actually learning how to play guitar, then they might have a crowd full of screaming women in front of them. Instead they have some pasty Best Buy employees, the IT department from Chubb, and a small percentage of South Korea’s teenage boy population. Perhaps that’s what they want, but it breaks my heart just the same.
But not as much as this. This guy might just be the greatest video game drummer in the history of mankind. When he dies, we’ll check his stats to be sure. But even if he’s second or third best, I can’t help but want to shake him silly.
To quote his youtube description: “I do not play the real drums.”
Because that would be a waste of time, wouldn’t it?
Another month, another stat blog post. I'm clearly a little farther behind schedule than I'd like to be also. But most notable in May was the drop in volume. It looks like it's perked back up now in mid-June, but...May is a mystery. Here are the full stats:
- Total: 261
- Requested: 9
- Categories of Requested: 2 picture books, 1 middle-grade fantasy, 2 contemporary YA, 1 paranormal YA, 1 dystopian YA, 1 YA fantasy, 1 adult non-fiction
- Queries with attachments: 10
So compared to last month, I got about 100 fewer queries. That's a big drop. Where did people go? I will say that there are 166 queries in the queue for June so far, so I should be back up to the 300+ level for this month. Yay.
Still, my request rate was up again. So qualitatively, things seemed better. And I had a few referrals of manuscripts that I requested as well, which don't really count as slush pile submissions.
Otherwise, I don't think there was anything truly notable worth mentioning. The usual array of misspellings, calling me the wrong name, derivative books...
If you have questions, definitely let me know.
I promised. So here we go...
- Total: 351
- Requested: 8
- Categories of Requested: 3 MG, 3 contemporary YA, 1 YA fantasy, 1 narrative nonfiction
- Queries with attachments: 15
- People who wrote thank you notes: 18
So compared to last month, I saw a 22% increase in queries. My request rate also went up a little. But...it's still only just shy of 3%. (Isn't that scary?) And again, there were some spam queries that all the agents I know, and some I don't, were CCed on. I delete those right away, mark as spam, and don't count them.
My thoughts...
Style
There were a few notable events in the query pile this month that show me how little people must research ahead of time. There was one email in a pink font on a flowery pink background. My eyes hurt just opening it, and I didn't even care what the content was. Had it been on paper, I'd have expected glitter and perfume. There were also several letters that barely qualified as letters. Either incredibly casual, like "Hey there, can I send you something?" or just reeking of "I don't know what I'm doing." Those are hard to deal with, but by and large I try to find what the book is somewhere (if it's there) and send a rejection.
There's also still that weird syndrome of a lack of sample pages. I really think every listing of mine says: please include the first 3-5 pages of the manuscript in the body of the email. If it doesn't somewhere, can someone let me know?
I included the number of thank you notes I got for my form rejection letter. It's nice when people are polite. It's less nice when they also ask me if I can recommend another agent. I don't write back to these.
But at least compared the number of people who are still sending me attachments, there are more polite people than sloppy people. The number of unsolicited attachments I got DOUBLED this month. Probably a fluke, but it goes to the point that a solid 10% of people just aren't paying attention AT ALL. And many more just plain don't get it in the first place.
Requests
I seem to be on a middle-grade kick, which is good. I'm looking for good middle-grade, so my requests fit that bill. The concepts on each of these seemed promising, hence the requests.
Obviously the narrative nonfiction was an exception, since I so rarely do those books, but I loved the writing.
As for the YA, the contemporary YA seemed to be stronger this month in terms of writing and premise. I may also be burned out of dystopian and fantasy. Bear in mind, I already represent 3 authors who have published or about-to-be published dystopian novels. As much as I love them, I'm going to be picky. I don't want to be a one trick pony.
And that's April! Time to dig into May...and I enjoy this now, so stay tuned for the next installment next month.
I promised a few weeks ago that I'd do an experiment. So instead of deleting after responding, I moved every March query and its accompanying response from me into a new folder, so I could do some analysis. Here we go:
- TOTAL: 286
- REQUESTED: 3
- CATEGORY OF REQUESTED: 2 YA, 1 MG
- QUERIES WITH ATTACHMENTS: 7
- CATEGORIES I DON'T REP: 24
Other items of note:
Numbers:
The actual number of emails I received was a bit higher than 286. That number does not include anyone who emailed me a second time (almost immediately) with a correction to their prior query. I would guess there were a good 10 of those. And then there were a few cases where the querier CCed the entire industry on the email. I don't respond to those and they get deleted.
I should add also that while my request rate is always low, this month was very low. This is because I happened to sign 2 amazing new projects right in the middle of the month as I was beginning to read the March 1st queries. So as the ebb and flow goes, I was going to need to be really wowed to want to see something.
Genres:
If you think about how many queries were not categories I rep in relation to the total number received, that's about 10%. 10%! The bulk of them were for memoirs. I don't really do those. The remainder were largely for some non-specific type of adult fiction. And a minority were still for...vampires! Is there a listing for me anywhere that doesn't say "No vampires"? If there is, please let me know.
Addressing problems:
- ADDRESSED TO "Dear Agent": 3
- ADDRESSED TO "Ms. Johnson": 3
- ADDRESSED TO "Elana Johnson": 2
- SPELLED MY NAME "ELENA": 9
We're a small agency, peeps. There are 2 of us that work here. And only one of us is even open to submissions right now. That would be me. So these 17 queries that just didn't even know who I am are kind of annoying. And look how the misspelling of my name trumps the letter being addressed to someone other than me. Please read carefully. Double-check spellings of names. For your own sake. You look sloppy otherwise.
Miscellany:
This was the first month I got a query sent from an iPhone. Yep, "Sent from my iPhone" signature at all. And it was one of the categories I don't rep. So that person's tactics probably need some re-evaluation.
I also got a decent number of thank you notes and/or people asking me who else I'd recommend they query. Needless to say, I don't reply to those either. A rejection isn't an invitation to conversation, unless I indicate as much. You're responsible for your own research. I'm not doing it for you.
And then of course is the ever-rising syndrome of "just plain unprofessional" letters, that show me people are querying somewhat casually. Several other agents have commented on this on their blogs this week, so I'll just reiterate their points. Whether it's just that the internet blew the lid off the filters, or that people are lazy, it is definitely too easy to send off those letters. Whoever I'm railing against probably isn't reading this post, but at least I can hope that those of you who are will be better prepared.
Should I do it again for April? I think I might. I'd like to see if there's a rise or fall in any of the numbers.
Since we write for children, I figured you would be interested in the post that David L Harrison brought up on his blog. I thought the information was very interesting and felt you would, too.
This issue of Language Arts (January 2010) includes an article by Denise Davila and Lisa Patrick. The article is called “Asking the Experts: What Children Have to Say about Their Reading Preferences” and presents the findings of several studies on the subject. The authors remind us, “For the most part, adults control the world of children’s literature: adults write the books; adults choose which books to publish; adults review the books; adults bestow the awards on books; and adults purchase the books for their homes, book stores, and libraries. In the midst of all this adult control, children’s opinions are often overlooked.”
In one of the reported studies, the authors observe, “. . . when reading options are limited, students are left with three choices: reading something outside of their interests, obtaining their preferred materials themselves, or not reading at all. Students who cannot afford to buy their preferred materials are more dependent on school sources and, thus, their choices are even more limited.”
Several studies in the article present their findings when groups of boys and girls were asked what they like to read. Generally, both genders in grades three to five like scary, funny, and action-packed stories.
In general, avid readers of both sexes share many of the same reading interests although there are some differences. Girls more frequently choose fiction and boys more frequently choose nonfiction. Girls more frequently prefer to read catalogues, song lyrics, poetry, and cookbooks. Boys more frequently read informational materials about videogames, sports, cars, and trucks. Boys also like fantasy, crime/detective stories, and war/spy stories, comics, graphic novels, and joke books.
Where does poetry come in? Among 3,865 girls in one study, poetry was liked by 42%. Magazines (82%) ranked number one followed by text messaging, television, websites, catalogues, song lrics, jokes, fiction, newspapers, and comics. In a study of 4,341 boys, poetry came in at 22%. The only thing that ranked lower were plays, travel books, and cookbooks. Boys’ favorites were magazines, websites, jokes, comics, text messages, television, fiction, and newspapers.
I think this article gives us several points to consider, beginning with how hard it is to get past all the adults to reach our young audiences. We need to be aware that children do have rather specific tastes in what they prefer to read and among the few places where they have much control over their selections is on the Internet, when reading articles and stories in magazines, and text messaging with friends. Many children love books, too, but may have a hard time getting to the kinds of books they like.
This article concludes, “Just as children currently have strong preferences for reading subject matter that they access on websites or interactively construct via text messaging, it is inevitable that children’s reading preferences will continue to shift with the evolution of new media and technologies.”
Filed under:
article,
stats Tagged:
Boys,
Children,
Girls,
reading preferences  1 Comments on Children Reading Preferences, last added: 1/29/2010
View Next 7 Posts


.jpeg?picon=3075)
.jpeg?picon=3417)

.jpeg?picon=3514)
Can’t tell you how happy it makes me to hear such a positive response :)
Great news!
I will fall into a deep depression if don’t survive. I owe so much of my (relative) success today to local indie stores who were willing to promote an unknown author.