new posts in all blogs
Viewing: Blog Posts Tagged with: comichron, Most Recent at Top [Help]
Results 1 - 5 of 5
How to use this Page
You are viewing the most recent posts tagged with the words: comichron in the JacketFlap blog reader. What is a tag? Think of a tag as a keyword or category label. Tags can both help you find posts on JacketFlap.com as well as provide an easy way for you to "remember" and classify posts for later recall. Try adding a tag yourself by clicking "Add a tag" below a post's header. Scroll down through the list of Recent Posts in the left column and click on a post title that sounds interesting. You can view all posts from a specific blog by clicking the Blog name in the right column, or you can click a 'More Posts from this Blog' link in any individual post.
By John Jackson Miller (reprinted with permission from Comichron) There have been many Black Panther series over the years from Marvel, but the title has never been one to appear near the top of the sales charts. In April, the new series from Ta-Nahisi Coatesand Brian Stelfreeze not only was the comic book most ordered […]

By:
Heidi MacDonald,
on 6/17/2015
Blog:
PW -The Beat
(
Login to Add to MyJacketFlap)
JacketFlap tags:
Comics,
Retailing & Marketing,
Sales Charts,
Diamond,
Boom Studios,
Boom,
Top News,
Top Comics,
comichron,
Comic Sales,
Add a tag
Note: The distribution numbers used below are estimates, not hard sales numbers. They’re accurate to the trends, but take the exact unit measurements with a small grain of salt.
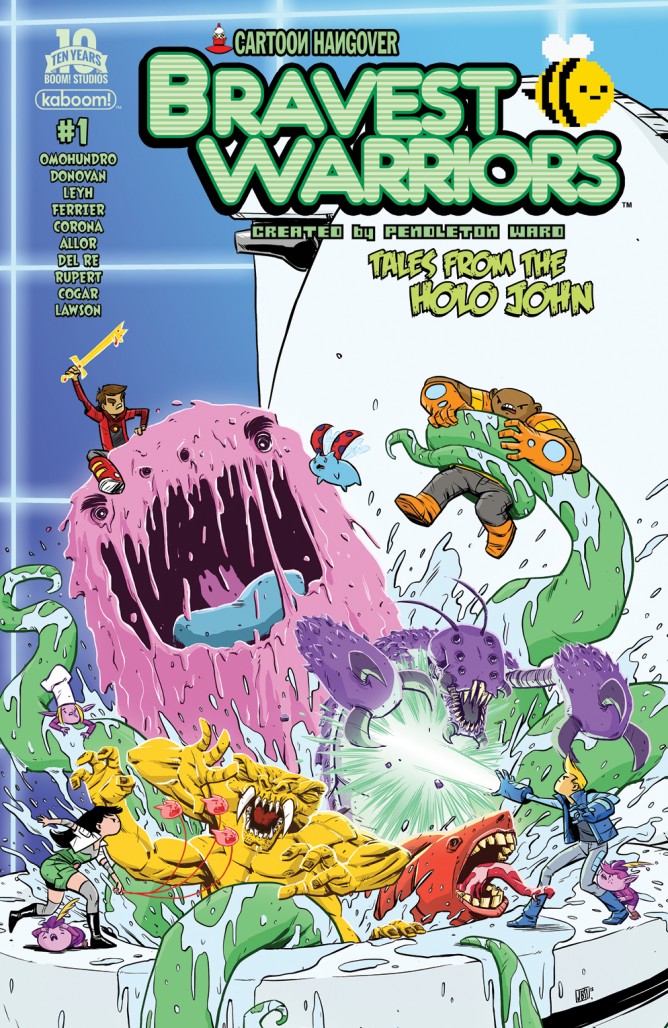
Recently, Comichron released Diamond distribution numbers for May 2015. To little astonishment at the feat but some awe at the scale, Marvel’s Secret Wars #1 took the number one slot for the month with 527,678 copies distributed to stores by Diamond, besting the distribution of DC’s April event book, Convergence #1, by nearly 400,000 copies. Interestingly, however, Boom’s Bravest Warriors: Tales from the Holo John #1 took the number two slot with 502,737 copies distributed, besting series based on established properties including Star Wars #5 (146,850), Deadpool’s Secret Secret Wars #1 (131,839), and Secret Wars #2 (210,807). In a world where even DC struggles to pull outstanding numbers on event books, which are traditionally considered to be defibrillators for comic sales, it’s surprising that a new title from one of the smaller major publishers pulled such a high distribution volume. How did Boom pull it off? Well, as Comichron writer John Jackson Miller notes in his analysis, “nearly 500,000 copies” were bought by Loot Crate, the largest nerd potpourri vendor on the internet.
According to the statistical analysis presented in the article, it is clear that the Loot Crate Effect has begun to not only change, but completely distort the direct market. Comic sales were up by $5,800,000 compared to May 2014, but $2,500,000 of that was thanks to the mass order Loot Crate placed on Holo John. That’s nearly half of the distribution growth. In a superficial analysis, you might think that this doesn’t really matter. After all, sales are sales, right? Regardless of who is buying or who ultimately ends up with the comic, greater sales mean healthier publishers.
However, while Loot Crate is definitely helping line publishers’ pockets, they aren’t nearly as helpful as you might expect.
Where we don’t see the distortion is in Diamond’s dollar shares, which only look at the dollars it was paid — and there, Boom is in fifth place. According to Diamond’s dollar rankings, it sold 2.4 copies of Bravest Warriors for every Secret Wars #2 it sold — and yet the distributor made more money on Secret Wars #2. Since Secret Wars #2 and Bravest Warriors cost the same — $4.99 — that would indicate that Loot Crate got a much better deal from Boom at wholesale on its copies than retailers got from Marvel.
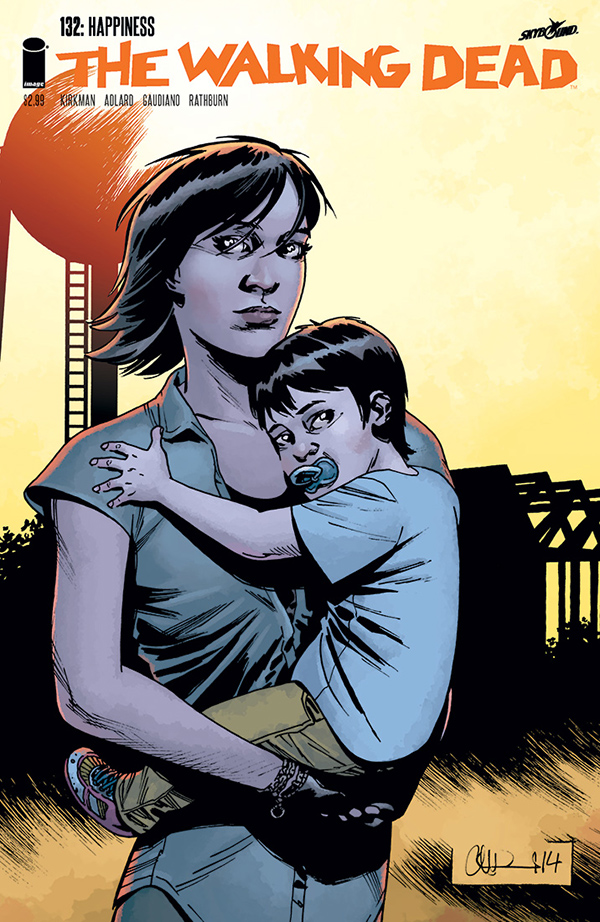
What this means is that even though Boom’s market share is rising in terms of quantity, the company’s profit margins aren’t improving enough to match that growth. Not only that, but there’s no quantifiable proof that readership improves after companies dump large quantities of a single issue into Loot Crate’s hands. October 2014’s The Walking Dead #132 is one of the best performing single issues of the 21st century with 326,300 copies distributed, over 200,000 of which were purchased by Loot Crate. Meanwhile, September 2014’s sales of issue 131 are reported to be 69,810 and November 2014’s sales of issue 133 stand at 68,093. There was actually a net loss of readership following The Walking Dead‘s appearance in the Loot Crate.
It’s harder to determine the effect that Loot Crate has on the readership of series that have their first issue included in the service. Rocket Raccoon #1 sold 311,000 copies, over 200,000 of which were bought by Loot Crate. Issue 2 sold 56,597 copies, which presents a steep drop in readership even if you ignore Loot Crate’s wholesale order on issue 1. That’s not an atypical performance trend in comics, but it does serve as addition indication that Loot Crate isn’t really helping sales in the long term.
Like event books, it seems like Loot Crate has become another sales defibrillator– a way to improve sales in the short term that doesn’t necessarily help the industry grow in the long run. On the plus side, selling mass orders to Loot Crate has a much lower production cost than the creation of a new event series, where you have to hire writers, artists, and saddle marketing with a lot of additional work. With Loot Crate, you just pull the trigger and print more copies of the book you already paid to have made anyways. Unfortunately, this new method doesn’t seem to pad profits nearly as much as event books do.
By John Jackson Miller
[Reprinted with permission from Comichron.com.]
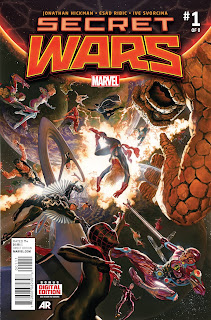 Marvel’s Secret Wars revival made a big splash in the comics market in May, moving more than 527,000 copies to comic shops in North America. That’s according to Comichron’s estimates for May 2015 comics sales based on information released by Diamond Comic Distributors. You can find the report here.
That’s enough to place the issue fourth on the list of best-selling comics of the century, and it could go higher with reorders. It came in a month when strong six-figure launches from A-Force and Old Man Logan, and a dominating performance from Batman: Earth 2 Vol. 2 on the graphic novel charts helped push the market to a 13% increase.
The Secret Wars issue edged out a surprise second-place finisher, Bravest Warriors: Tales from the Holo John #1 — and with the comic book, Loot Crate‘s effect on the Direct Market sales charts may finally have reached — pun entirely intended — cartoonish levels. Just over half a million copies of the comic book based on the animated series were shipped by Diamond, and indications are that most of those copies went directly to one customer: Loot Crate, which then doled them out to its subscribers (who do not know in advance what comic books they’re going to receive). When the regular Bravest Warriors title appeared on the periodical charts more than a year ago, it was selling around the 4,000 copy level, and while this first issue likely sold more copies than that in comic shops, it’s likely that more than 98% of the copies went to one customer.
The massive single order had effects on the charts in several ways. Comics unit sales were up 20% over last May: 7.5% of that came from the Loot Crate copies. Industry sales went up $5.8 million versus last May, but $2.5 million of that came fromBravest Warriors. The title cost $4.99, so it helped punch up the weighted average cover price — the price of the average comic book Diamond shipped — to a record $4.17; without the inclusion of the Loot Crate books, that average drops to $4.11. (Still a record, but it only beats the last one — set in April — by nine cents.) It also sent Boom‘s market share northward, making it the #4 publisher in terms of units sold last month — and #3 in dollar sales within just the Top 300.
Where we don’t see the distortion is in Diamond’s dollar shares, which only look at the dollars it was paid — and there, Boom is in fifth place. According to Diamond’s dollar rankings, it sold 2.4 copies of Bravest Warriors for every Secret Wars #2 it sold — and yet the distributor made more money on Secret Wars #2. Since Secret Wars #2 and Bravest Warriors cost the same — $4.99 — that would indicate that Loot Crate got a much better deal from Boom at wholesale on its copies than retailers got from Marvel. In the case of this issue and Februrary’s chart-topping Orphan Black, it’s probably more appropriate to look at these as promotional copies. Diamond stopped including comics promotionally cover-priced below $1 in its charts several years ago, but there doesn’t appear to be a rule concerning a wholesale price minimum. (If there were, we wouldn’t see graphic novels sold at deep discounts included in the charts — and those have often distorted the sales figures by several million dollars.)

There is, again, no single rule I can think of that would easily fit all occasions here — and as the number of box offerings proliferates, the potential impact on the charts grows. (Secret Wars #1 itself was in the Comic Block, Geek Fuel, and Comic Con boxes in May, and Convergence: Action Comics #1 andMythic #1 were also in the Comic Block box, although the numbers involved are likely much smaller than the Loot Crate case. It’s also not clear whether they’re all going through Diamond: DC didn’t go through Diamond with its first Loot Crate offering.) About the only suggestion I might have would be for Diamond to remove from the Top 300 charts sales any non-Direct Market accounts that do not order a variety of comics monthly; that would allow in sales from outlets like Hastings, but separate out promotional one-off purchases by outside firms. Such titles might be reported as an addendum to the charts, such that we’d know how they affected the market shares and bottom line; publishers would also see their sales reflected in that event. But that approach might be more difficult to do as the number of grab-bag retailers increases.
The aggregate changes are as follows:
TOP 300 COMICS UNIT SALES
May 2015: 8 million copies
Versus 1 year ago this month: +20%
Versus 5 years ago this month: +30%
Versus 10 years ago this month: +36%
Versus 15 years ago this month: +33%
YEAR TO DATE: 37.16 million copies, +16% vs. 2014, +29% vs. 2010, +26% vs. 2005, +30% vs. 2000
ALL COMICS UNIT SALES
May 2015 versus one year ago this month: +19.53%
YEAR TO DATE: +16.9%
TOP 300 COMICS DOLLAR SALES
May 2015: $33.34 million
Versus 1 year ago this month: +33%
Versus 5 years ago this month: +55%
Versus 10 years ago this month: +96%
Versus 15 years ago this month: +105%
YEAR TO DATE: $146.69 million, +21% vs. 2014, +46% vs. 2010, +75% vs. 2005, +94% vs. 2000
ALL COMICS DOLLAR SALES
May 2015 versus one year ago this month: +19.94%
YEAR TO DATE: +16.48%
TOP 300 TRADE PAPERBACK DOLLAR SALES
May 2015: $7.27 million
Versus 1 year ago this month: unchanged
Versus 5 years ago this month: +21%
Versus 10 years ago this month, just the Top 100 vs. the Top 100: +28%
Versus 15 years ago this month, just the Top 25 vs. the Top 25: +34%
YEAR TO DATE: $35.1 million, -1% vs. 2014
ALL TRADE PAPERBACK SALES
May 2015 versus one year ago this month: -0.29%
YEAR TO DATE: +3.41%
TOP 300 COMICS + TOP 300 TRADE PAPERBACK DOLLAR SALES
May 2015: $40.61 million
Versus 1 year ago this month: +26%
Versus 5 years ago this month: +38%
Versus 10 years ago this month, counting just the Top 100 TPBs: +72%
Versus 15 years ago this month, counting just the Top 25 TPBs: +118%
YEAR TO DATE: $181.76 million, +16% vs. 2014
ALL COMICS AND TRADE PAPERBACK SALES
May 2015 versus one year ago this month: +13.49%
YEAR TO DATE: +12.31%
OVERALL DIAMOND SALES (including all comics, trades, and magazines)
May 2015: approximately $48.89 million (subject to revision)
Versus 1 year ago this month: +13%
Versus 5 years ago this month: +39%
Versus 10 years ago this month: +83%
YEAR TO DATE: $233.5 million, +12% vs. 2014
RELEASES
New comic books released: 436
New graphic novels released: 228
New magazines released: 44
All new releases: 708
As mentioned above, the average cover price of the comic books in Diamond’s Top 300 was $3.95, a record; there were 205 comics priced at $3.99, 26 above that mark, and 69 below. There were only 38 comics in the chart prices at $2.99, the previous most common price point. Click to see cover prices across time.
Our joint report with ICV2 on 2014’s overall comics sales is being finalized; look for it here in the coming days.
BY JOHN JACKSON MILLER
[Reprinted with permission from Comichron]
With today’s release of December comics orders from Diamond Comic Distributors — and our subsequent analysis and estimates for December 2014 comics sales now posted — Comichron has drawn upon that information to project estimates for the Top Thousand Comics and the Top Thousand Graphic Novels for 2014. Click to see them.
 The tables are on the page just beneath the image links to individual months. As in past years, it is a large page, necessarily, so it may take a bit to load. Also as in the past, I have rounded off estimates to the nearest hundred comics.
Before launching into a discussion of what’s on the list, some more general thoughts on 2014, now that we’ve seen all the data:
• Last winter stank, but it didn’t matter. Headlines for comics sales in January, February, and March 2014 were dire in many places (though not here); the Direct Market was off 4% in the first quarter, overall, or about $5 million. But comics shops made that up in April alone. Across the next three quarters. the market was up 7.1%, or $28 million — allowing the final comics and graphic novel total sale for the year to be up more than 4%, or $23 million to $540.4 million.
It’s a good reminder that not all sales seasons are created equal (especially not as January 2014 had one of its weeks given to December 2013 in the accounting), and that the amount of volume in the market is what matters. It is also a good reminder as we look ahead to the figures for the first part of this year, which will be infused by Star Wars #1‘s blockbuster sales: its effect is likely to be even further amplified given the lower amount of releases to the market in the winter. The addition of a million-copy book to a market that might only see 6 or 7 million copies sold in January could be quite significant.
• 2014 was not the year of the blockbuster — despite a new record-setting comic book. As noted further below, Amazing Spider-Man #1 from April broke all sales records from the last fifteen years — but it was largely an outlier, as six months out of twelve the top-seller for the month was the book that leads the list when no blockbusters are around: Batman. (Not that Batman’s sales haven’t been blockbuster some months in the past, just that it is the typical industry leader in non-event months.) This seems to have played out in the charts in general, as we see in the Top Thousand and the larger indexes that the upper tier books didn’t carry as much weight this year, even as comics sales overall grew.
Here’s some visible evidence of the shape of the market, as seen on the lists. We find the following breakdowns for unit sales:
NUMBER OF COMIC BOOK ISSUES SELLING
AT LEAST THIS MANY COPIES DURING YEAR
200,000+ |
100,000+ |
75,000+ |
50,000+ |
25,000+ |
10,000+ |
| 2009 |
2 |
39 |
119 |
379 |
n.a. |
n.a. |
| 2010 |
0 |
26 |
94 |
303 |
955 |
n.a. |
| 2011 |
3 |
42 |
86 |
343 |
984 |
n.a. |
| 2012 |
5 |
63 |
129 |
403 |
1100 |
2250 |
| 2013 |
6 |
64 |
178 |
390 |
1128 |
2430 |
| 2014 |
4 |
40 |
108 |
401 |
1195 |
2353 |
Another way to look at the above is: where does the 100,000-copy level start on the chart? In 2010, every book above 26th place sold that many copies or more; in 2014, six-figures started at 40th place.
As you can see, the upper tiers, above 75,000 copies, fell off dramatically from 2013 to 2014. But the next tiers bulked up. The best guess is that about 3,800 comics sold at least 5,000 copies — which makes sense, considering that’s about where the 300th place cutoff is each month these days.
Now to that list. The Top Thousand Comics account for around 52.07 million copies; that’s well over half of all the comics that Diamond sold. The figure is down from 54.21 million copies in 2013, though Diamond’s unit sales of comics overall were up 0.25%. In 2012 the figure was 53.43 million copies; in 2011, it was 47 million copies, and in 2010, the total was 45.3 million copies.
Using our database to project sales for other issues, it appears that the Top 2,500 Comics for the year sold around 78 million copies, down from 79 million in 2013. So the farther down the list we go, the more the unit sales picture improves.
In full retail dollars, the Top Thousand Comics sold for $201.03 million, a $1 million drop from last year’s total of $202.02 million. (See the 2013 article here and charts here.) Again, since Diamond’s dollar sales for comics were up 4%, it’s clear that the highest-selling comics were not where the growth was last year — but rather, the titles selling fewer than 25,000 copies each. And it’s growth from 2012’s figure, which was $191.4 million. (See the 2012 article here and charts here.)
Doing the same estimating for the Top 2,500 Comics puts 2014 ahead of 2013, $294 million versus $288 million.
Once again this year, almost every single one of the Top 100 comics on the list had a “multiple order codes” notation from Diamond, meaning there were variant covers or reprints combined to make the main entry.
The Top Thousand Graphic Novels, led by Saga Vol. 3, went for $81.19 million, up from $79.03 million in 2013, from $71.4 million in 2012, and from $58.4 million in 2011. Combined, the Top Thousand Comics and Top Thousand Graphic Novel lists account for about 52% of the orders by dollars Diamond received in publishing last year, which was around $540 million. That percentage is down from 54% in 2013 and 55% in 2012. Again, the best-selling books are accounting for less and less, even as the pie grows larger.
TOP COMICS OF THE YEAR, DECADE, AND CENTURY
The renumbered Amazing Spider-Man #1 was the top seller of the year; Comichron estimates that, all told, around 559,200 copies of the issue, including all variants, were ordered by Direct Market retailers in North America. That’s enough to make it the highest-selling comic book of the 21st Century through the end of 2014; Marvel’s Star Wars #1, released last week, will easily surpass it, but we won’t see it on the list until Diamond releases its 2015 end-of-year data next year.
So it will be a short reign for the Spider-Man issue atop the list — less than a year. The issue takes the spot held for five years by the Obama Amazing Spider-Man #583, with orders of 530,500 copies in 2009. You can see the updated top-sellers by year here.
The entire Top Comics of the 21st Century list has been updated, and it has been split into lists for thedecade of 2000-2009 and the decade of the 2010s. One more comic book from 2014, Walking Dead#132, cracked the Top 10 for the Century, landing at #8. It’s the third year in a row an issue from the series has broken into the list, but this one comes with a dagger in our charts, noting that most of its sales came from a single gigantic purchase by the repackager Loot Crate. While the copies were sold by Diamond and can’t be separated out, it is worth some kind of footnote so readers in future years will know why this one issue ranked the way it did.
The Top 10 since 2000, up to 2014:
TEN MOST ORDERED COMIC BOOKS OF THE 21ST CENTURY (up to 2014)
| |
Comic-book Title |
Issue |
Ship |
Price |
Publisher |
Est. sales |
| 1 |
Amazing Spider-Man (new series) |
1 |
Apr-14 |
$5.99 |
Marvel |
559,200 |
| 2 |
Amazing Spider-Man |
583 |
Jan-09 |
$3.99 |
Marvel |
530,500 |
| 3 |
Walking Dead (including Chromium edition) |
100 |
Jul-12 |
$3.99 |
Image |
384,800 |
| 4 |
Civil War |
2 |
Jun-06 |
$2.99 |
Marvel |
341,900 |
| 5 |
Civil War |
3 |
Jul-06 |
$2.99 |
Marvel |
337,000 |
| 6 |
Walking Dead |
115 |
Oct-13 |
$2.99 |
Image |
329,300 |
| 7 |
Civil War |
1 |
Feb-13 |
$3.99 |
Marvel |
328,500 |
| 8 |
Walking Dead† |
132 |
Oct-14 |
$2.99 |
Image |
326,300 |
| 9 |
Justice League of America |
1 |
Feb-13 |
$3.99 |
DC |
326,000 |
| 10 |
Captain America |
25 |
Mar-07 |
$3.99 |
Marvel |
317,700 |
Uncanny Avengers #1 and Civil War #4 were bumped from the Top 10.
Fourteen issues from 2014 made the Top 300 for the 21st Century list, once again fewer than last year. Five 2014 issues made the Top 100, and four made the Top 50.
THE PUBLISHERS
Who published the Top Thousand Comics this year? Here’s the breakdown:
Marvel: 512 (+20 from 2013)
DC: 407 (-3 from 2013)
Image: 57 (+8 from 2013)
Dark Horse: 14 (-4 from 2013)
Archie: 4 (+3 from 2013)
Titan: 3 (+3 from 2013)
IDW: 1 (-14 from 2013)
Valiant: 1 (unchanged from 2013)
Dynamite: 1 (unchanged from 2013)
That’s a pretty short list, with Aspen and Boom dropping out. Titan made the list, thanks to Doctor Who. Marvel picked up a bunch, while the biggest drop-off belonged to IDW, mostly for the reason that My Little Pony isn’t as high on the charts as it was in 2013.
And here’s the publisher breakdown of the Top Thousand Graphic Novels. Those with 10 or more entries:
DC: 393 (+31 from 2013)
Marvel: 251 (-37 from 2013)
Image: 115 (+19 from 2013)
Dark Horse: 88 (-3 from 2013)
IDW: 36 (-6 from 2013)
Random House: 25 (+8 from 2013)
Boom: 19 (+7 from 2013)
Viz: 17 (+1 from 2013)
Oni: 10 (+1 from 2013)
Marvel’s loss is almost the size of DC’s gain, and Image picked up a lot. Random House and Boom also made headway into the list.
Walking Dead softcovers and hardcovers in the Top 2,500 added up to more than $6.5 million at retail — with comics bringing the total for the line up to nearly $10.8 million. That’s enough to give it a market share of exactly 2%, which would make it once again the seventh largest publisher for the year, after Dynamitewere it a separate firm.
COVER PRICES
The average cost of the comic books retailers ordered in the Top Thousand was $3.86, but that goes down to $3.79 when you extend the chart to the Top 2,500. The average comic book offered in 2014 only cost $3.72, so people are tending toward the more expensive comics. This may also explain why the books at the top of the charts aren’t pulling the same weight as they had before when it comes to number of units moved: the books atop the charts were more likely to cost more.With the December data, we now have a 20-year monthly track on comics sales. While average prices on the covers of all offerings (the black line) and the average price of all the comics retailers bought (the red line) have been increasing, we note that they haven’t been too far off what prices would have been if they followed inflation exactly. The green line below tracks what the average comic book at the end of 2014 — $2.25 — would have cost if it followed the inflation rate exactly:

Since comics are linked to prices to other goods and services — like paper and ink, and what it costs to hire talent — it’s not too surprising that the average prices tend to have been a bit higher. And we can see that there have been times in which prices have increased faster than others: particularly 2008-2010, when major publishers tried to go from $2.99 to $3.99 in defiance of the general recession the rest of the economy was suffering. Comics publishers pulled back on price increases at that point. But generally, we might expect that a $2.25 comic book in 1994 ought to cost about $3.50 now — which it might if most publishers didn’t eschew half-dollar increments. We’re not far off of that.
To a degree, some of the perception of high comics prices comes from a lack of collective memory about what comics used to cost: look back on monthly changes over time and annual median prices since 1961 here. And the track of the green line above would be different depending on what year it started in: 1994 was a year in which paper supply was in great demand, and so that $2.25 baseline could already have been high. But there generally haven’t been many wild departures from inflation in the general economy in the last 20 years.
Repeating the end-of-year report, the comic shop market in North America ordered more than $540 million worth of comics and graphic novels in 2014, an increase of 4% over 2013. The final end-of-year report, bringing in outside channels and digital, will appear later this year. You can look back on the 2013 Overall charts here.
There are 23 other years of Diamond annual reports on the site, going back to 1991. You can also find comparatives for how the market as a whole did across that time by viewing our Yearly Comics Salespage.
 John Jackson Miller has tracked the comics industry for more than 20 years, including a decade editing the industry’s retail trade magazine; he is the author of several guides to comics, as well as more than a hundred comic books for various franchises. He is the author of several novels including Star Wars: Kenobi, Star Wars: A New Dawn, and the upcoming Star Trek: The Next Generation – Takedown, releasing January 27. Visit his fiction site athttp://www.farawaypress.com.
 by John Jackson Miller
Comics sales months in the mirror may be smaller than they appear. That’s one of the lessons of the data released today byDiamond Comic Distributors about comics sales in March 2014, as analyzed by Comichron. Click to see the comics sales estimates for March 2014.
March’s sales to comics shops overall only represented a slight cooldown from March a year ago — and as reported here on Friday, the big action was in the graphic novel sector. Walking Dead Vol. 20 led the graphic novel charts — and with Saga Vol. 3 and an expensive Stray Bullets volume in the Top 10, Image posted its highest market share since November 2000, with an 11.38% dollar share. (November 2000‘s mark was 12.54%.) But while March 2013′s numbers posed a difficult comparative to beat — I called it a “blockbuster for this time of year” — going inside the numbers shows that last year’s totals were a bit of a mirage.
The Top 300 graphic novels this March, for example, were actually down 4% versus March 2013—even though the graphic novel category overall last month was up 18.31%. Why such a discrepancy? Because as Comichron noted at the time, March 2013′s graphic novel charts were artificially inflated by Marvel’s deep-discounting of several million dollars’ worth of hardcovers. So March 2013′s Top 300 graphic novels had a total retail value of $8.97 million versus $8.65 million this March —but the publishers and Diamond realized far less money from them.
The overall graphic novel percentage changes that Diamond reports, meanwhile, are calculated based on wholesale value — how much money retailers paid — and there, it’s clear that while more dollars worth of material moved through the system in March 2013, discounts weren’t as deep on what Diamond sold this year, and it and publishers realized more from the sales.
If we take the analysis down to units, we see that this March’s 300th-place graphic novel sold 490 copies, whereas last March’s book in that spot sold only 413. So we’re really looking at a comparison with a March 2013 chart that was seriously distorted by a lot of high-dollar value books sold at very high discounts.
The 300th-place comic book sold 4,940 copies this March versus 4,077 last March — almost exactly ten times the number of graphic novels sold in that spot in each month we’re comparing.
Meanwhile, on the five-year comparison tracks, we’re finally comparing against recessionary months in the Direct Market — the boost lent by the Obama Spider-Man issue in January and February 2009 was no longer in the picture. The market may have sold a million fewer comics in the Top 300 in March 2014 versus March 2013, but it sold a million more than in March 2009.
The aggregate change figures:
TOP 300 COMICS UNIT SALES
March 2014: 6.22 million copies
Versus 1 year ago this month: -14%
Versus 5 years ago this month: +17%
Versus 10 years ago this month: -2%
Versus 15 years ago this month: -4%
YEAR TO DATE: 20.93 million copies, -13% vs. 2013, +10% vs. 2009, +8% vs. 2004, -1% vs. 1999
ALL COMICS UNIT SALES
March 2014 versus one year ago this month: -11.83%
YEAR TO DATE: -11.40%
—
TOP 300 COMICS DOLLAR SALES
March 2014: $22.98 million
Versus 1 year ago this month: -11%
Versus 5 years ago this month: +29%
Versus 10 years ago this month: +23%
Versus 15 years ago this month: +42%
YEAR TO DATE: $68 million, -10% vs. 2013, +21% vs. 2009, +41% vs. 2004, +44% vs. 1999
ALL COMICS DOLLAR SALES
March 2014 versus one year ago this month: -9.47%
YEAR TO DATE: -6.89%
—
TOP 300 TRADE PAPERBACK DOLLAR SALES
March 2014: $8.65 million
Versus 1 year ago this month: -4%
Versus 5 years ago this month: -26%
Versus 10 years ago this month, just the Top 100 vs. the Top 100: +1
Versus 15 years ago this month, just the Top 25 vs. the Top 25: +51
YEAR TO DATE: $20.63 million, -9% vs. 2013
ALL TRADE PAPERBACK SALES
March 2014 versus one year ago this month: +18.31%
YEAR TO DATE: +1.39%
—
TOP 300 COMICS + TOP 300 TRADE PAPERBACK DOLLAR SALES
March 2014: $31.64 million
Versus 1 year ago this month: -9%
Versus 5 years ago this months: +13%
Versus 10 years ago this month, counting just the Top 100 TPBs: +15%
Versus 10 years ago this month, counting just the Top 25 TPBs: +56%
YEAR TO DATE: $88.64 million, -10% vs. 2013
ALL COMICS AND TRADE PAPERBACK SALES
March 2014 versus one year ago this month: -1.48%
YEAR TO DATE: -4.4%
—
OVERALL DIAMOND SALES (including all comics, trades, and magazines)
March 2014: approximately $40.73 million (subject to revision)
Versus 1 year ago this month: -1%
Versus 5 years ago this month: +31%
Versus 10 years ago this month: +36%
YEAR TO DATE: $116.59 million, -4% vs. 2013
The average comic book in the Top 300 cost $3.64; the average comic book retailers ordered cost $3.70. The median price for comics offered was $3.99, and the most common price for comics offered was also $3.99. Click to see comics prices across time.
So the market ends the quarter about $5 million off the pace of 2013, a not-unexpected place for it to be given the winter weather, the lack of major event titles, and the degree to which 2013′s volume was impacted by heavy discounting.
A reminder: Free Comic Book Day is May 3. And check the Comic Shop Locator Service to find a comic shop near you.


 By John Jackson Miller (reprinted with permission from Comichron) There have been many Black Panther series over the years from Marvel, but the title has never been one to appear near the top of the sales charts. In April, the new series from Ta-Nahisi Coatesand Brian Stelfreeze not only was the comic book most ordered […]


I added to the original story (once I finally located the link) that Boom’s move had been announced last fall: http://icv2.com/articles/news/view/32847/boom-studios-comic-production-cuts
I could not find similar announcements from others, but I would assume they were all responding to similar market information. Rebalancing shifts back and forth like this have been a common practice over the years; it’s common to see years where graphic novel volumes grow and comics don’t, and vice versa.
The problem is with most comics costing around $4 on average, it makes more economic sense to wait for the $9 to $11 TPB which tends to collect, at least, four issues if not more.
Single issues are vital to the health of the industry but the price point is a killer for most customers.
The total number of paying customers for monthly comics has been shrinking for decades. while production costs have been going up as publishers focused on making higher quality products for adult readers with disposable income. These adult readers with disposable income apparently demand high standards. Higher quality is the comic industry’s common explanation for the higher cost of comics.
The most common explanation for why periodicals are more expensive these days is because there are less customers to spread the costs out. In other words, economies of de-scale , the opposite of economies of scale, are the culprit.
Print has been displaced by new media over the last thirty years to some degree but I don’t think a empirical explanation has been put forward.
New media is sexy but it isn’t exactly “cheaper” than a comic.Video games still require upfront cost if the “replay value” is high. The internet and cable TV provide a lot of entertainment options but are more expensive than the things they displaced: newspapers, magazines, local TV stations.
What if there are other factors, besides production quality and economies of scale.
What if the cost of paper is a contributing factor to the decline of print?
What if profit seeking content providers moved over the new media because costs were rising more slowly in new media?
https://books.google.com/books?id=58DqCQAAQBAJ&pg=PA123&lpg=PA123&dq=newspapers+1990s+%22cost+of+paper%22&source=bl&ots=NiCtnd7NnA&sig=KYVoMT87Ooq0-GGkeAZk1kp0d5k&hl=en&sa=X&ved=0ahUKEwjJhbDxrt_MAhWJcT4KHUEfCy4Q6AEIHTAA#v=onepage&q=newspapers%201990s%20%22cost%20of%20paper%22&f=false
In addition to this, I think we need more context.
How are other forms of media, media that monthly periodical comics doing in comparison to comics?
Video games, movies, books?
I think it may be safe to say that digital sales are a not insignificant since neither the Outside World publishers, creators, or online comic enthusiasts talk about them regularly.
I read a post, the other day, either this blog or Bleeding Cool, about how motion comics were the future of the comics industry. Creators and publishers who didn’t adapt by digitizing their content would bite the dust. Is there any wide consensus among industry professionals about that? It seem similar to statements that stated that if comics didn’t adapt by being more diversity-orientated, they would bit the dust. There’s no evidence that shows that technology or diversity is reversing the plight of monthly comics.
*”How are other forms of media, media that monthly periodical comics doing in comparison to comics?”
should be
“How are other forms of media, media that monthly periodical comics are in competition with, doing in comparison to comics?”
30 years ago I got hooked on comics.
15 years ago I spent ~$120/month, going into the LCS every Wednesday with delight.
10 years ago I began to budget and be selective due to pricing.
5 years ago I started dabbling in alternate means to reading than buying new/retail: library, digital, flea market-style regional comic “conventions” (talking like 50 comics for $20 type stuff), piracy.
Currently, I don’t buy anything new and have not darkened the doorway of a comic shop in years.
And despite the relative ease and lack of real money spent in order to read comics, there’s very little I even want to read anymore. What happened to comics? Or, what happened to me?
There HAS to be a saturation point. How many publishers can print comics month after month, and rely on pull lists for their survival? I am astonished at how many titles are solicited in PREVIEWS each month. Are there really THAT many comic readers out there, to support all that printing??