new posts in all blogs
Viewing: Blog Posts Tagged with: credit, Most Recent at Top [Help]
Results 1 - 17 of 17
How to use this Page
You are viewing the most recent posts tagged with the words: credit in the JacketFlap blog reader. What is a tag? Think of a tag as a keyword or category label. Tags can both help you find posts on JacketFlap.com as well as provide an easy way for you to "remember" and classify posts for later recall. Try adding a tag yourself by clicking "Add a tag" below a post's header. Scroll down through the list of Recent Posts in the left column and click on a post title that sounds interesting. You can view all posts from a specific blog by clicking the Blog name in the right column, or you can click a 'More Posts from this Blog' link in any individual post.

By: Alice,
on 2/28/2014
Blog:
OUPblog
(
Login to Add to MyJacketFlap)
JacketFlap tags:
explorer,
infographic,
African Americans,
novices,
Social Sciences,
*Featured,
Images & Slideshows,
social explorer,
demography,
Online products,
employment rates,
household ownership,
per capita income,
demographic,
interface,
History,
interactive,
black history month,
Current Affairs,
Geography,
America,
census,
Add a tag
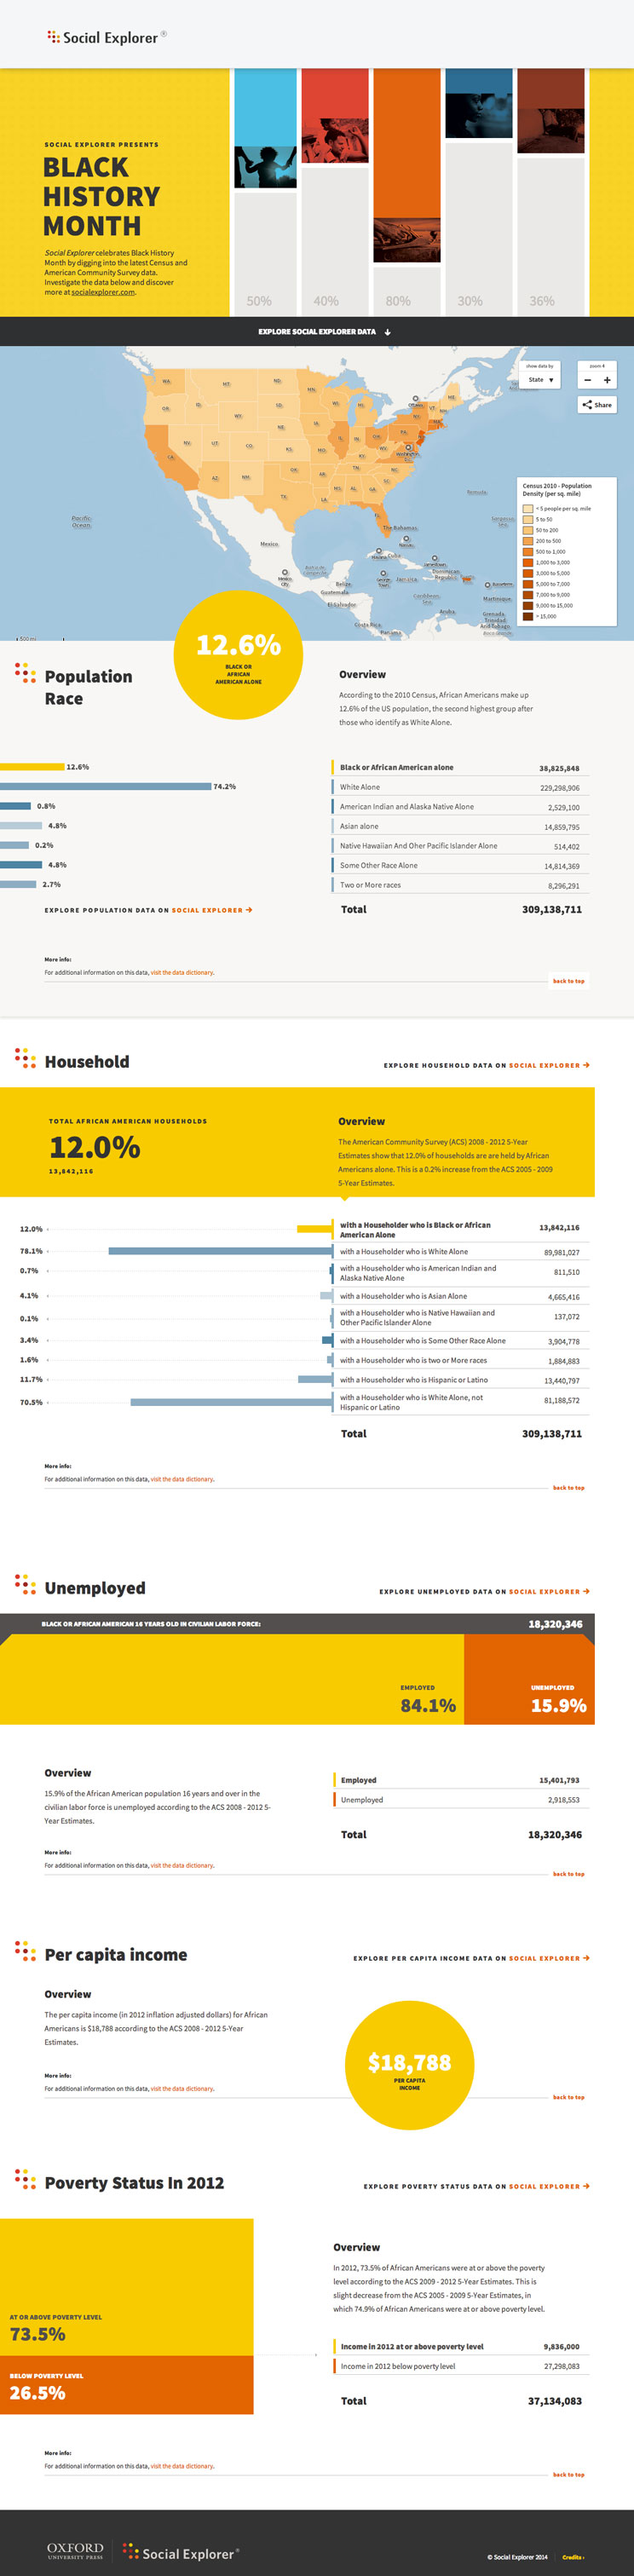
In celebration of Black History Month, Social Explorer has put together an interactive infographic with statistics from the most recent Census and American Community Survey. Dig into the data to find out about current African American household ownership, employment rates, per capita income, and more demographic information.
Take a sneak peak below and visit Social Explorer Presents Black History Month for the full, interactive infographic.
Social Explorer provides quick and easy access to current and historical census data and demographic information. The easy-to-use web interface lets users create maps and reports to illustrate, analyze, and understand demography and social change. In addition to its comprehensive data resources, Social Explorer offers features and tools to meet the needs of demography experts and novices alike. From research libraries to classrooms to government agencies to corporations to the front page of the New York Times, Social Explorer helps the public engage with society and science.
Subscribe to the OUPblog via email or RSS.
Subscribe to only social sciences articles on the OUPblog via email or RSS.
The post African American demography [infographic] appeared first on OUPblog.

By: ErinF,
on 2/2/2013
Blog:
OUPblog
(
Login to Add to MyJacketFlap)
JacketFlap tags:
History,
US,
groundhog day,
Sociology,
groundhog,
Pennsylvania,
Multimedia,
jefferson,
census,
Research Tools,
imbolc,
punxsutawney phil,
Social Sciences,
*Featured,
candlemas,
punxsutawney,
social explorer,
Sydney Beveridge,
hibernating,
demography,
Online Products,
Jefferson County,
‘groundhog,
examining census,
our mapping,
Add a tag
In the United States, a German belief about the badger (applied in Switzerland to the wolf) has been transferred to the woodchuck, better known as the groundhog: on Candlemas he breaks his hibernation in order to observe the weather; if he can see his shadow he returns to his slumbers for six weeks, but if it rains he stays up and about, since winter will soon be over. This has earned Candlemas the name of ‘Groundhog Day’. In Quarryville, Lancaster County, Pa., a Slumbering Groundhog Lodge was formed, whose members, wearing silk hats and carrying canes, went out in search of a groundhog burrow; on finding one they watched its inhabitant’s conduct and reported back. Of twenty observations recorded, eight prognostications proved true, seven false, and five were indeterminate. The ritual is now carried on at Punxsutawney, Pa., where the weather prophet has been named Punxsutawney Phil. (The Oxford Companion to the Year)
By Sydney Beveridge

Every February Second, people across Pennsylvania and the world look to a famous rodent to answer the question—when will spring come?
For over 120 years, Punxsutawney Phil Soweby (Punxsutawney Phil for short) has offered his predictions, based on whether he sees his shadow (more winter) or not (an early spring).
The first official Groundhog Day celebration took place in 1887 and Phil has gone on to star in a blockbuster film, dominate the early February news cycle, and even appear on Oprah. (He also has his own Beanie Baby and his own flower.)
In addition to weather predictions, Phil also loves data, and while people think he is hibernating, he is actually conducting demographic analysis. As a Social Explorer subscriber, he used the site’s mapping and reporting tools to look at the composition of his hometown.
Click here to view the embedded video.
Punxsutawney, PA, located outside of Pittsburgh, is part of Jefferson County. Examining Census data from 1890, Phil learned that the population was 44,405 around the time of his first predictions. While the rest of the nation was becoming more urban, Jefferson County remained more rural with only one eighth of the population living in places with 2,500 people or more (compared to nearly half statewide and more than a third in the US).
Many Jefferson residents worked in the farming industry. Back then, there were 3.2 families for every farm in Jefferson County — higher than the rest of the state with 5.0 families per farm.
Less than three decades after the Civil War, the county (located in a northern state) was 99.9 percent white, which was a little higher than statewide (97.9 percent) and also higher than nationwide 87.8 percent. (The Census also noted that there was one Chinese resident of Jefferson County in 1890.)
Groundhog Day was originally called Candlemas, a day that Germans said the hibernating groundhog took a break from slumbering to check the weather. (According to the Oxford Companion to the Year.) If the creature sees its shadow, and is frightened, winter will hold on and hibernating will continue, but if not, the groundhog will stay awake and spring will come early. Back in 1890, there were 703 Germans living in Jefferson County (representing 1.6 percent of the county population and 11.3 percent of the foreign born), making Germany the fourth most common foreign born place of birth behind England, Scotland, and Austria. Groundhog Day is also said to be Celtic in its roots, so perhaps the 623 Irish residents (representing 1.4 percent of the county population and 10.1 percent of the foreign born) helped to establish the tradition in Pennsylvania.
Looking to today’s numbers, Phil was astonished to learn from the 2010 Census that Jefferson County has just 795 more people than it did 120 years ago. While Jefferson grew by 1.8 percent, the state grew by 141.6 percent and the nation grew by 393.0 percent.
2010 Census Jefferson County, PA, Population Density (click to explore)
Phil dug deeper. The 2008-10 American Community Survey data reveal that the once-prominent farming industry had shrunk considerably. (Because it is a small group, “agriculture” is now grouped with other industries including forestry, fishing and hunting, and mining.) While Jefferson residents are more likely to work in the industry than other Pennsylvanians, that share represents just 4.4 percent of the employed civilian workforce.
According to the Census, Jefferson is still predominately white (98.3 percent), while the rest of the state and nation have become somewhat more diverse (81.9 percent white in Pennsylvania and 72.4 percent nationwide). Today there are 24 Chinese residents (out of a total of 92 Asian residents).
As Phil rises from his burrow this February second, he will survey the shadows with new insight into his community and audience. To learn more about Punxsutawney Phil’s hometown burrow (and your own borough), please visit our mapping and reporting tools.
Sydney Beveridge is the Media and Content Editor for Social Explorer, where she works on the blog, curriculum materials, how-to-videos, social media outreach, presentations and strategic planning. She is a graduate of Swarthmore College and the Columbia University Graduate School of Journalism. A version of this article originally appeared on the Social Explorer blog. You can use Social Explorer’s mapping and reporting tools to investigate dreams, freedoms, and equality further.
Social Explorer is an online research tool designed to provide quick and easy access to current and historical census data and demographic information. The easy-to-use web interface lets users create maps and reports to better illustrate, analyze and understand demography and social change. From research libraries to classrooms to the front page of the New York Times, Social Explorer is helping people engage with society and science.
Subscribe to the OUPblog via email or RSS.
Subscribe to only American history articles on the OUPblog via email or RSS.
The post Burrowing into Punxsutawney Phil’s hometown data appeared first on OUPblog.

By: ErinF,
on 1/21/2013
Blog:
OUPblog
(
Login to Add to MyJacketFlap)
JacketFlap tags:
fulton,
Online Products,
fulton county,
Georgia,
History,
statistics,
US,
Sociology,
Data,
african american,
African American Studies,
census,
Martin Luther King Jr. Day,
Research Tools,
martin luther king jr,
county,
Editor's Picks,
*Featured,
social explorer,
Sydney Beveridge,
demography,
Add a tag
By Sydney Beveridge
Martin Luther King, Jr. was the legendary civil rights leader whose strong calls to end racial segregation and discrimination were central to many of the victories of the Civil Rights movement. Every January, the United States celebrates Martin Luther King, Jr. Day to honor the activist who made so many strides towards equality.
Let’s take a look at the demographics of the legendary man’s hometown then and now to see how it has (and has not) changed. King was born in 1929, so we’ll examine Census data from 1930, 1940, and the latest Census and American Community Survey data.
His boyhood home is now a historic site, situated at 450 Auburn Avenue Northeast, in Fulton County (part of Atlanta). In 1930, Fulton County had a population of 318,587 residents. A little over two thirds of the population was white (68.1 percent) and almost one third of the population was African American (31.9 percent). Today, the 920,581-member population split is nearly even at 44.5 percent white and 44.1 percent African American, according to 2010 Census data. Fulton’s population is more African American than the United States as a whole (12.6 percent), but not as as much as Atlanta (54.0 percent).
A closer look at 1940s Census data of the Atlanta area offers more detail about where the black and white populations lived. The following map shows the distribution of the black population in the Atlanta of King’s youth. Plainly, African Americans lived together, largely apart from whites.
African American Population in Fulton County, GA, and Surroundings, 1940 (click map to explore)

For comparison, the following map shows where the black population lives today. Now the black population has expanded in the metro area, but still seems to be quite segregated.
African American Population in Fulton County, GA, and Surroundings, 2010 (click map to explore)

Reflecting on a century after the end of slavery, King said in his famous “I Have a Dream” speech of 1963:
But one hundred years later, the Negro still is not free. One hundred years later, the life of the Negro is still sadly crippled by the manacles of segregation and the chains of discrimination. One hundred years later, the Negro lives on a lonely island of poverty in the midst of a vast ocean of material prosperity. One hundred years later, the Negro is still languished in the corners of American society and finds himself an exile in his own land. And so we’ve come here today to dramatize a shameful condition.
The quest for equal rights and freedoms made up part of a larger vision. In 1967, he spoke of aspiring for full equality at a speech at the Victory Baptist Church in Los Angeles:
Our struggle in the first phase was a struggle for decency. Now we are in the phase where there is a struggle for genuine equality. This is much more difficult. We aren’t merely struggling to integrate the lunch counter now. We’re struggling to get some money to be able to buy a hamburger or a steak when we get to the counter…
He went on to say that this would require a commitment of not only political initiative but also money: “It didn’t cost the nation one penny to integrate lunch counters. It didn’t cost the nation one penny to guarantee the right to vote. The problems that we are facing today will cost the nation billions of dollars.”
In 1968, King and other activists launched the Poor People’s Campaign, advocating for economic justice to address these imbalances in opportunity and resources. A few months later, he was assassinated.
We can look at different socioeconomic indicators to measure the country’s progress towards equality. According to 1940 Census data, more than a third (36.5 percent) of housing units in Fulton County where whites lived were owner occupied, compared to less than a seventh (14.0 percent) of the housing units where African Americans lived.
Today, home ownership increased for both groups, but the gap remains. Two thirds (66.6 percent) of white households are owner-occupied, compared to two fifths (41.7 percent) of all black households.
Home Ownership Comparison in Fulton, GA, by Race

Let’s examine other measures of equality to see examples of additional gaps.
The unemployment rate is nearly twice as high among African Americans (17.9 percent) compared to among whites nationwide (9.5 percent). That gap is even more pronounced in Fulton County, where the unemployment rate for whites is 7.7 percent, while the unemployment rate for African Americans is 20.4 percent.
The percent of those living below poverty is also higher in the black community (27.2 percent) than in the white community (12.5 percent). While both groups are better off in Fulton County than the rest of the US, the poverty rate gap is even larger (8.2 percent among whites and 26.6 percent among African Americans in Fulton).
Similarly, while both groups are better educated in Fulton County compared to the rest of the US, nearly two thirds (62.4 percent) of white adults in the county have BA degrees or more, while just one quarter (25.3 percent) of the black population have the same level of education. The college attainment gap is 11.6 percentage points nationwide, but 37.1 percentage points in Fulton County.
While much progress towards freedom and equality has been made since King’s time, chronic gaps persist, even in his own backyard. The data show that 50 years after the “I Have a Dream Speech,” equal opportunity and socioeconomic status continue to lag behind equal rights.
Sydney Beveridge is the Media and Content Editor for Social Explorer, where she works on the blog, curriculum materials, how-to-videos, social media outreach, presentations and strategic planning. She is a graduate of Swarthmore College and the Columbia University Graduate School of Journalism. A version of this article originally appeared on the Social Explorer blog. You can use Social Explorer’s mapping and reporting tools to investigate dreams, freedoms, and equality further.
Social Explorer is an online research tool designed to provide quick and easy access to current and historical census data and demographic information. The easy-to-use web interface lets users create maps and reports to better illustrate, analyze and understand demography and social change. From research libraries to classrooms to the front page of the New York Times, Social Explorer is helping people engage with society and science.
Subscribe to the OUPblog via email or RSS.
Subscribe to only American history articles on the OUPblog via email or RSS.
The post Checking in on Martin Luther King, Jr.’s dream, with data appeared first on OUPblog.

By: Alice,
on 12/28/2012
Blog:
OUPblog
(
Login to Add to MyJacketFlap)
JacketFlap tags:
quiz,
gorgeous,
Geography,
atlas,
census,
geographic,
Atlas of the World,
satellite,
Social Sciences,
*Featured,
oxford’s atlas,
slickquiz,
annually,
Add a tag
School might be out for the holidays, but there’s still lots to learn. Since education never ends, we’ve prepared this geography quiz drawn from facts from the Oxford Atlas of the World, 19th edition. The only atlas to be updated annually, Oxford’s Atlas of the World combines gorgeous satellite images with the most up-to-date geographic and census information.
Your Score:
Your Ranking:

Oxford’s Atlas of the World — the only world atlas updated annually, guaranteeing that users will find the most current geographic information — is the most authoritative resource on the market. The Nineteenth Edition includes new census information, dozens of city maps, gorgeous satellite images of Earth, and a geographical glossary, once again offering exceptional value at a reasonable price.
Subscribe to the OUPblog via email or RSS.
Subscribe to only geography articles on the OUPblog via email or RSS.
Image credit: From Atlas of the World, 19th edition.
The post Atlas of the World Quiz appeared first on OUPblog.


By: Anastasia Goodstein,
on 4/4/2012
Blog:
Ypulse
(
Login to Add to MyJacketFlap)
JacketFlap tags:
Teens,
bullying,
Tweens,
facebook,
census,
Youth Marketing,
dosomething,
bully,
Collegians,
Social Activism,
victoria justice,
the bully project,
step up to bullying,
Add a tag
 We chatted with Naomi Hirabayashi and Chloe Lee at DoSomething about their new anti-bullying effort — a bullying census on Facebook tied with the release of the documentary “Bully.” They’re hoping not only to get an accurate picture of... Read the rest of this post
By: Justyna,
on 3/1/2012
Blog:
OUPblog
(
Login to Add to MyJacketFlap)
JacketFlap tags:
gerontologists,
retirement,
employer,
census,
baby boomers,
workers,
whistler,
Social Sciences,
*Featured,
employer-provided retirement plans,
journal of gerontology,
rosemary wright,
predictors,
gerontologist,
pensioner,
employers’,
Sociology,
gender,
Add a tag
By Rosemary Wright

Greenwich pensioner by Whistler 1859. Source: Library of Congress.
In 2011, the oldest Baby Boom workers reached the age of 65 — an age that more than 60 million Baby Boomers will reach by 2030. The issue of retirement weighs particularly on women, who are likely to outlive men and therefore have a longer period of retirement to finance.
In the study “Paying for Retirement: Sex Differences in Inclusion in Employer-Provided Retirement Plans,” I turned to the Baby Boomers to determine whether this new generation of women were well-prepared with retirement benefits. Is the retirement gap between Baby Boom men and women narrower than for older retirees? Are women still dependent on a husband’s retirement income for security in old age? To look at these differences, I examined a large sample obtained from the 2009 Current Population Survey for the differences between Baby Boom men and women’s inclusion in retirement plans, as well as predictors of inclusion in these plans.
The results of the new study showed a significantly higher percentage of women than men (68.4% vs. 65.2%) worked for an employer who offered retirement benefits. A slightly higher percentage of men than women (92.4% vs. 91.1%) were included in their employers’ retirement programs. Overall, significant positive predictors of working for an employer with a retirement plan were sex (women more likely than men), employment in a core industry or in a primary occupational sector, educational attainment, and government worker status (government workers more likely than non-government workers). On the other hand, significant negative predictors were minority status (minorities less likely than non-minorities), age (older workers less likely than younger workers), having children younger than age 18 (those with children under the age of 18 less likely than those with no children under 18), and immigrant status (immigrants less likely than non-immigrants).
Minority status and educational level were the only two predictors for which there was a significant sex difference. Minority women were less likely than minority men to work for an employer with retirement benefits. As educational attainment increased, men were more likely than women to work for an employer providing retirement benefits.
Significant positive predictors of a worker actually being included in an employer’s retirement program were age (older workers more likely to be included than younger workers), employment in a core industry or in a primary occupational sector, educational attainment, marriage (married workers more likely than non-married workers), and government worker status. Minority status was the only significant negative predictor of inclusion (minority workers less likely than non-minority workers to be included).
There was only one variable with a significant difference between men and women: government employment. Female public employees were more likely than male public employees to be included in their employers’ retirement programs.
Two major good-news stories emerge from this study. First, a much larger group of workers is included in an employer’s retirement plan in this study than received pension benefits in earlier studies. This reflects the expansion of the types and availability of retirement benefits available to workers today, and is a good sign for retirement security as Baby Boom workers begin to retire. Second, there was only one predictor for which the likelihood of being included in a retirement
By: Lauren,
on 9/20/2011
Blog:
OUPblog
(
Login to Add to MyJacketFlap)
JacketFlap tags:
gender,
back to school,
census,
Research Tools,
explorer,
catching,
genders,
*Featured,
social explorer,
Sydney Beveridge,
college degree,
attainment,
degrees,
high school degree,
enrolled,
censuses,
Education,
Add a tag
By Sydney Beveridge
Some of the earliest detailed census data on education came from 1850 when the census reported information about school attendance. For many decades, the census focused on literacy rates, which we discussed in part two of the back to school series.
By the mid-1900s, data on educational attainment emerged (elementary school, high school, college, etc.), adding new insight into education

“Today, the marriage rate among librarians is the highest it has ever been with 62 percent of librarians married in 2009.”
There is a lot of data in the world. Librarians are good at using census data to help people find families, get local information and just learn something about the way the world used to be. Here’s a neat post about using hte census data from the last 120 years to learn something about librarianship as a profession. Did you know that the number of self-reported librarians peaked in 1990 and has declined almost 30% since then? I am somewhat curious if this is just because people with library and information science backgrounds are calling themselves all manner of things now [Is a taxonomist a librarian? How about a metadata specialist?]. You can read the full post, with graphs, over at Oxford University Press’s Social explorer.
By: Lauren,
on 6/20/2011
Blog:
OUPblog
(
Login to Add to MyJacketFlap)
JacketFlap tags:
census,
1990,
*Featured,
wages,
median,
Images & Slideshows,
Andrew Beveridge,
social explorer,
Sydney Beveridge,
ipums,
librarian,
ala,
US,
librarians,
Education,
american library association,
Add a tag
An analysis using 120 years of census data
By Sydney Beveridge, Susan Weber and Andrew A. Beveridge, Social Explorer
The U.S. Census first collected data on librarians in 1880, a year after the founding of the American Library Association. They only counted 636 librarians nationwide. Indeed, one respondent reported on his census form that he was the “Librarian of Congress.” The U.S. Census, which became organized as a permanent Bureau in 1902, can be used to track the growth of the library profession. The number of librarians grew over the next hundred years, peaking at 307,273 in 1990. Then, the profession began to shrink, and as of 2009, it had dropped by nearly a third to 212,742. The data enable us to measure the growth, the gender split in this profession known to be mostly female, and to explore other divides in income and education, as they changed over time.
We examined a number of socioeconomic trends over the duration, and focused in on 1950 the first year that detailed wage data were recorded, 1990 at the peak of the profession and 2009 the most currently available data.1 We looked at data within the profession and made comparisons across the work world.

For the first 110 years of data, the number of librarians increased, especially after World War II. In 1990, the trend reversed. Over the past 20 years, the number of librarians has dropped by 31 percent, though the decline has slowed.
Considering the nation today, the states with the largest librarian populations are: Pennsylvania, Illinois, New York, Texas and California. Meanwhile, the states with the highest concentrations of librarians (or librarians per capita) are: Vermont, D.C., Rhode Island, Alabama, New Hampshire. Table 1 in the appendix gives the count and proportion of librarians by state in 2009.
Median Earnings
 The Census Bureau has kept records of librarian wages since 1940. Median2 Librarian wages (whether full-time or part-time) increased until 1980, though they were a lower percentage of the median wages of all workers. Indeed, between 1970 and 1980 librarian wages declined nearly $4,000—more than twice the drop of median wages across all professions. (This wage drop was in the context of the Oil Embargo in the mid-1970s, and the economic fall-out that that caused.) In 1990 Librarian median wages declined further and were the same as those for all workers, but by 2009 they had gained in relative terms, and reached their peak of $40,000. (All these figures are adjusted for inflation.) By 2009 the typical librarian earned over one-third more than a typical US worker. According to the Census results, Librarians have enjoyed consistently high employment rates. For instance in 2009, the unemployment rate among librarians was just two percent–one-fifth the national rate.
A Feminine Profession
Today, 83 percent of librarians are women, but in the 1880s men had the edge, making up 52 percent of the 636 librarians enumerated. In 1930, male librarians were truly rare, making up just 8 percent of the librarian population.
The US Census released 2010 demographic data a few days ago. Among the data being pointed to in articles and essays is that "...American Indians and Native Hawaiians and Pacific Islanders are the most likely to report being of more than once race. Blacks and whites are the least likely." That excerpt appears in the New York Times, in the March 24, 2011 article by Susan Saulny.
It suggests that more American Indians claim more than one race than was the case in the past, that there is more mixing than ever before. I don't doubt that, but let's hit the pause button...
I'm tribally enrolled with Nambe Pueblo. I grew up there. My daughter and I, like my parents, grandparents, siblings, cousins, etc., live our identity as Indians of Nambe Pueblo.
I teach at the University of Illinois in Urbana-Champaign. In every class I teach, I've got a handful of students who say they have a great grandparent who was Native. They don't know what tribe that ancestor was, and, they usually have only a vague idea of what it might mean to be Native. Most of them have no idea of Native Nations, of Native sovereignty, of being on a tribal census, what treaties mean, that dances might be sacred... A great many of them romanticize an Indian identity based on popular culture and (sadly) biased teachings in school. Some of them manufacture that identity, putting it on in the form of, for example, a bone choker. They mean no harm. In fact, they wear such things with great pride. But! They don't live a specific Native Nation identity.
Yet, many of them check a box on school enrollment forms, and, likely on the U.S. Census, that says they're part Indian. And so, the statistics are kind of... skewed.
A few months ago, the Times ran another article in which college students reported being mixed, some of them with Native heritage, but that none of those distinct identities mattered.
Identity matters for those of us who are raised Indian. We work very hard at maintaining our nationhood and our sovereignty, and, we work to protect the integrity of our traditions from being exploited by people who don't understand them...
The students interviewed for that Times article mean no harm when they say their Indian identity doesn't matter. It doesn't matter---to them. But it does to me, and it does to Native Nations. The students' well-meaning embrace of a mixed identity, in effect, obscures a lot, and in that obscurity, it does do harm. It contributes to the lack of understanding of who American Indians are... And it takes the US down a merry melting pod road where we all hold hands and smile in ignorance.
Ignorance is not bliss. It is ignorance.
You don't have to be ignorant. You can learn a lot about American Indians, and know us---and maybe your own ancestry---for who we were and are, rather than some abstract stereotypical notion you've been carrying around.
Spend some time on American Indians in Children's Literature, learning about who we are and what we care about. Read our newspapers! Check out Indian Country Today. Read Mark Trahant's columns there, and see how ICT covers mascot stories. Listen to our radio stations! Start with National Native News. Did you know we have Tribal Colleges? And a journal called Tribal College Journal that you can read online? There's a lot to know!
By: Kirsty,
on 2/24/2011
Blog:
OUPblog
(
Login to Add to MyJacketFlap)
JacketFlap tags:
History,
UK,
Politics,
feminism,
suffrage,
census,
feminists,
*Featured,
1911 census,
elizabeth crawford,
history workshop,
jill liddington,
suffrageists,
suffragettes,
census’,
suffragette,
Add a tag
By Jill Liddington
Elizabeth Crawford and I, suffrage historians both, watched with keen interest in early 2009 as the 1911 census began to go online. On Tuesday 13 January selected English counties became fully searchable by the public. Excitement was palpable. By midnight, there had been 3.4m searches and 17.4m pages viewed, particularly by family historians. But it was suffragettes who grabbed attention – with headlines like ‘1911 Census: the secret suffragettes who refused to be counted’.
We joined the searchers at the National Archives to look for the census schedules of known Votes for Women campaigners. Among our early discoveries were, as we expected, suffragette evaders – whose names were absent on their own household census. We also came across resisters writing ‘No Vote, No Census’ angrily across their schedule. For instance, one suffragette in Essex wrote on hers, at an unrepentantly defiant angle:
‘I, Dorothea Rock, in the absence of the male occupier, refuse to fill up this Census paper as, in the eyes of the Law, women do not count, neither shall they be counted.’
But we found many other schedules at odds with our expectations. All our suffrage reading had led us to believe that census evasion and resistance had been very widespread up and down the country. But the primary evidence we were uncovering suggested considerably lower levels of boycott activity; and this hinted at a more complex mix of individual motives in households on census night. We were puzzled by these unexpected suffragette rejections of the call to boycott the census. So we began to read more widely and to revisit the broader historical context.
Our article suggests how we’ve tried to make sense of the puzzling evidence we were uncovering. We named this ‘the battle for the 1911 census’ as a way of suggesting explanations for the patterns we found emerging.
Read on for an excerpt from their paper ”‘Women do not count, neither shall they be counted’: Suffrage, Citizenship and the Battle for the 1911 Census”, which is published in History Workshop Journal, Advanced Access, 23 February 2011. You can read the full article for free on the journal’s website.
* * * * *
Amid all the suffragette propaganda, it was probably the Women’s Freedom League’s uncompromising Manifesto, ‘No Votes for Women – No Census’, that had widest and most immediate impact. Issued under the names of Edith How Martyn and Charlotte Despard, it quickly caught the eye of The Times, which quoted from it extensively. The Times dilated on WFL plans to refuse ‘to give intimate personal details’ to the enumerator, and, under the heading ‘Obstruct Government Business’, noted that the WFL even incited members to:
… oppose, hamper, destroy if possible, the power of an unrepresentative Government to govern women, refuse to be taxed, boycott the Census, refuse all official information until women have won that which is their absolute right – the right of a voice and vote.
The very next day The Times published a short yet pointed letter rebutting this Manifesto argument, from the eminent educational reformer Professor Michael Sadler of Manchester University. He warned the WFL that ‘to boycott the Census would be a crime against science’ because ‘upon the completeness of the Census returns’ depended future legislation to better the conditions f
By: Lauren,
on 9/28/2010
Blog:
OUPblog
(
Login to Add to MyJacketFlap)
JacketFlap tags:
American History,
immigration,
A-Featured,
A-Editor's Picks,
citizenship,
census,
1920s,
applications,
passport,
robertson,
optional,
Craig Robertson,
passports,
passport in america,
proof of identity,
shipley’s,
shipley”,
Add a tag
By Craig Robertson
1) The passport in its modern form is a product of World War I. During the war most countries introduced emergency passport requirements that became permanent in the 1920s under the guidance of the League of Nations. Prior to World War I in the absence of required passports and visas immigration and government officials along the U.S. border used people’s physical appearance to determine if they were entitled to enter the country. Inspectors were confident they knew what an “American” looked liked, along with their ability to “recognize” non-citizens who where banned such as prostitutes, imbeciles, and those too sick to work.
2) Middle-class and the more well-to-do resisted the implementation of passport requirements creating what was labeled the “passport nuisance” in the 1920s. With little experience of the need to prove identity through documents the passport became the site where people objected to perceived affront of a government not trusting its citizens. Identity documents were for people who could not be trusted such as criminals and the insane. They were not for people who simply wanted to travel.
3) The federal government did not claim universal birth registration until 1930; in the early 1940s the Census Bureau estimated that 40% of the population did not have a birth certificate. This example of the limited administrative reach of the federal government hindered attempts to create a rigorous application process for the passport.
4) Prior to the 14th Amendment free African Americans used passport applications to support their citizenship claims. These applications for optional passports exploited the tension between federal and state citizenship and inconsistencies in State Department passport policy.
5) The State Department frequently used the passport promote good behavior and to discourage behavior that could be considered inappropriate especially in regard to the family: in an era of optional passports the State Department encouraged the issuance of one passport for married couple or an entire household in the name of the husband; in the late 1880s the State Department refused to issue passports to Mormons traveling abroad on the grounds they were assumed to be recruiting people for polygamy; in the early 1920s the State Department fought with some success a demand that married women be able to get passports issued in their maiden names.
6) From 1928 until 1977 two women ran the Passport Division, both of who were ultimately forced out of their positions. Appointed in 1928, Ruth Shipley the first woman to head a division in the State Department became notorious, publicly represented as “Ma Shipley” the individual who read and decided on all passport applications. For opponents Shipley’s Passport Division was “government by a woman, rather than by law.” She was removed when her refusals, often done without recording reasons in files, became part of controversy over the denial of passports to suspected communists in the early 1950s. She was replaced in 1953 by Francis Knight who quickly earned the title “the J. Edgar Hoover of the State Department” but oversaw passports for a quarter of a century before being removed.
Craig Robertson is an Assistant Professor of Communication Studies at Northeastern University. His new book, The Passport in America: The History of A Document, examines how “proof of identity” became so crucial in America. Through addressing questions of identification and surveillance, the history of the passport is revealed.
The census, however flawed and necessary it may be, has triggered some great writing and thinking about race and how we define ourselves. From CNN we have two great essays: journalist and filmmaker Raquel Cepeda writes on being Latino and the stories her family has told of their mixed heritage, and author Walter Mosley brings us a poetic look at the 10,000 years of history that led to him.
A different exploration of heritage is being undertaken by two Native American Tribes on Long Island: they’re working with Stony Brook University to recreate their historical languages and hope to teach them to the next generation, bringing the languages back after 200 years of silence.
Zetta Elliott, author of Bird, takes a look at her Canadian origins, her interactions with Canadian publishers, and, of course, race in children’s books—particularly its exoticization, its otherness.
And lastly, Binyavanga Wainaina explores that exoticization in a piece entitled “How to Write about Africa” —actually a list of rules he, and we, wish authors writing cross-culturally would not follow, but that they all too often do. “Always end your book with Nelson Mandela saying something about rainbows or renaissances. Because you care.“
Filed under:
Diversity Links Tagged:
African/African American Interest,
Biracial interest,
Census,
Latino/Hispanic/Mexican Interest,
Native American Interest 


Author Chang-Rae Lee speaks about what box he’s going to check on his census, and how little it says about him:
Most interesting to me is his comments on the white box as opposed to the many Asian boxes. There are eleven subcategories of Asian, including two fill-in options. The American Indian/Alaska Native box comes with a fill-in to list your tribe. Black and white, however, only get one box each. It doesn’t differentiate between Black people of Caribbean, Sub-Saharan African, Northern African, or “descended from slaves” heritages. It doesn’t differentiate between WASPs, Ashkenazim, Scandinavians, or Irish.
Maybe it has to do with the assumption of privilege. White people are assumed to be privileged and black people are assumed to be disadvantaged; that assumption wipes away all internal distinctions. Asian Americans aren’t painted in such broad strokes, which allows a greater level of distinction to take place. But, as Chang-rae Lee says, even that doesn’t tell us much.
Filed under:
Diversity Videos Tagged:
Asian/Asian American Interest,
Census 


For the past two years, Dr. Scott Nicholson at the Syracuse iSchool has conducted an annual census to help us learn more about libraries offering gaming services. I can’t tell you how valuable that data has been when I get calls from reporters, so I’m hoping you’ll help us continue to build this archive of information.
If your library offered any type of gaming program last year (board games, video games, computer games, etc.), please fill out the survey before it closes on May 31. It’s open to all types of libraries, and Scott will publish the results for everyone, just as he’s done for the last two years.
Thanks!


Tags:
census,
gaming in libraries,
scott nicholson
This is an annual survey done by Dr. Scott Nicholson, associate professor at Syracuse University’s School of Information Studies, and is designed to collect information about gaming programs run in libraries in 2007. This can be any type of game (board, card, video, chess, puzzle) at any type of library (public, school, academic, or special). The focus is on gaming programs, where the libraries schedule an event of some type featuring games, and on gaming programs that were run sometime during the 2007 calendar year.
You can take this survey at http://www.surveymonkey.com/s.aspx?sm=64bf17n2mW5s4QdKL6ctxg_3d_3d until the end of July.
Data from last year’s census has been valuable in helping us to understand how libraries are using gaming and to get funding for other gaming programs. Adding data about your institution to our census will help us better understand how libraries are using data. You can see the publications that have used this data at http://gamelab.syr.edu/publications/. The results from this survey will be presented at the 2008 ALA TechSource Gaming, Learning, and Libraries Symposium.
Questions? Contact Scott Nicholson at [email protected]. I can tell you that having this kind of data has been crucial when talking with reporters, so I hope you’ll help and fill out the form for this year’s survey. Thanks!
census,
gaming and libraries,
gaming in libraries,
scott nicholson
By: Rebecca,
on 2/25/2008
Blog:
OUPblog
(
Login to Add to MyJacketFlap)
JacketFlap tags:
Health,
Economics,
A-Featured,
Medical Mondays,
cards,
Psychology,
finance,
broke,
power,
banks,
credit,
soman,
cheema,
limit,
mastercard,
stuart,
vyse,
going,
spending,
purchasing,
Add a tag

Stuart Vyse is Professor of Psychology at Connecticut College, in New London. In his new book, Going Broke: Why Americans Can’t Hold On To Their Money, he offers a unique psychological perspective on the financial behavior of the many Americans today who find they cannot make ends meet, illuminating the causes of our wildly self-destructive spending habits. In the excerpt below Vyse looks at the psychology of credit limits. Check out the tips he provided us with this morning or his podcast.
The Magic of Credit Limits
It is a wonderful feeling. You apply for your first MasterCard, hoping to be accepted. Finally it arrives in the mail, and you feel like a million bucks. It is shiny and new, and it comes with a letter that tells you your credit limit. In most cases, this happy event occurs when you are quite young: just after graduation from high school or somewhere in your twenties. As a result, the credit limit often seems like an amazingly large figure. (more…)
Share This


Debbie, did you see Henry Louis Gates' genealogy series on PBS, "African-American Lives," where he traced the ancestry of prominent African-Americans? Most of the people he interviewed claimed to have Native ancestry, too, but when they did the genetic testing, I believe only one of them did. They were all disappointed.
Anyway, Professor Gates discusses the issue candidly and intelligently, so you might want to check out the dvds some time, if you haven't seen the series. There were two different six-episode series that focused on African-Americans, and I believe it was the second one with Don Cheadle where he discussed it.
It seems to be something deep in the psyche of both white and Black Americans -- a yearning for Native ancestry.
I saw parts of it, KT, specifically his interview of Louise Erdrich. Here's the link.
http://www.pbs.org/wnet/facesofamerica/profiles/louise-erdrich/10/
He asks her how she identifies. She says Mother, Writer, and "of course, Native American." She goes on to talk about her identity, the history of her tribe, how her ancestors fought for that identity...
Great article. I studied political science at UCD and one of my courses was comparative politics: Indigenous Political Systems, with professor Glenn T. Morris. It was an very eye-opening class. He talked about this difference in understand identity in that class and in others I took. I got very interested in the subject and it has influence my thinking a great deal. I'm a musician and last year I wrote a song about this subject. It is called "Speaking Fantasy" by Eval Herz (that's the stage name I chose to use because my real name is Evan Herzoff). I'll tweet this article because I think people need to understand this better, especially in the United States. Thank you.
Thank you for talking about this. It's something I wrestle with every time I see the checkboxes for racial demographics, so it's illuminating to read your perspective.
Debbie, Louise Erdrich was part of the third series where he traced the family histories/genealogies of Americans with diverse background, including Erdrich, Yo Yo Ma, Eva Longoria, and Meryl Streep.
In the first two series he focused on African-Americans, and I believe it was in "African-American Lives II" where he talked at some length about Blacks who grew up hearing they had Native ancestry. (As I recall, I think it may have only been Oprah Winfrey who truly had Native ancestry.)
KT,
There are a lot of white and Black Americans who do have Native heritage. The task for them is to do the genealogical research to figure out what tribe that ancestor belonged to, and then, continue with that research and work, to learn about that tribe and if it is possible to reconnect with family members there.
When I think of a yearning for things-Indian, I think of the new age movement, and individuals who "go Indian" to fill a void, who yearn for something (in this case an Indian spirituality) that they think will bring meaning to their lives.
Another form of that yearning, I think, is addressed in Phil Deloria's PLAYING INDIAN. Early colonists wanted so much NOT to be "European" that they started playing Indian to mark themselves as not-European.
Another dimension of that yearning is a nostalgic longing for something from the past.
Enslavement of eastern indigenous people by european colonists was performed with such enthusiasm that there they have mixed black descendants not only in the south east of the US but the Caribbean as well. There are plenty who just want to have Indian ancestry, but for many its family history that has been ignored by the mainstream.
Thank you so much for this post and your entire blog. I appreciate all I am reading and learning.
Genetic testing for "markers" of Native ancestry is an extremely blunt tool at best; it's most reliable when dealing with unbroken lines of descent, and that is pretty problematic when dealing with the nations of the Northeast and Southeast, where there is frequently a multigenerational history of intermarriage. This briefing paper from the Indigenous Peoples Council on Biocolonialism goes into some considerable detail pointing out the issues: I'd especially like to note this following passage:
...There is another possibility of false negatives from these types of tests as well. This other type of false negative would arise if some Native American people simply do not have one or more of the ”Native American” markers. Scientists have not tested all native people, so they do not know for sure that Native Americans only have the markers they have identified...
In the Southeast and New England, there is a long history of Native communities with extensive African-American intermarriage having been declared "extinct" and redefined as colored or mulatto. Call me cynical, but I can't help but wonder if the initial survey testing to determine which genetic markers are Indian markers bothered to include any subjects from these unrecognized communities.
Thanks for this great post. Reading your post right after reading the original news story really helped put things in perspective.
Did you see this one on NPR?
Native American Intermarriage Puts Benefits At Risk
Excellent discussion. I am working on a teacher (K-12) inservice project (documentary film/website) on one of the questions raised here, namely "What should any teacher know about indigenous cultures in North America to be a good classroom teacher?" And of course the best source of information for this Teacher-To-Teacher Project are tribal teachers and leaders themselves. Be glad to discuss this further. [email protected]
In the NativeAppropriations blog you've have frequently linked to there was a post about a question in a local bar's trivia contest. "Name an athlete on a professional sports team who is a Native American." There was a caveat added by the MC--Real blood Indian.
I took that to mean a decline in tolerance among the majority for the "My great-great grandmother was a Cherokee Princess" trope. But it also raises the Blood Quantum and the question of exactly who has the right to say someone is or isn't a Native American.
It's a thorny question. You seem to be saying that the person cut off from his heritage doesn't have real American Indian Identity. Yet, a child adopted and raised in a community can find he is a NOT a Native American, no matter how he defines himself, because he doesn't have the right genetic heritage.
Anon at 1:32:
Who gets to say? The tribal nation does. The United States has ways it decides who is a citizen of the United States. Same thing with tribal nations. They decide. Someone else does not decide for them.
I don't think there was ever much "tolerance" for the "my great great grandmother was a Cherokee Indian princess" amongst tribally enrolled American Indians. Within a lot of Native humor, you'll find that claim provides a lot of fodder for jokes and the like.
In terms of who decides and how... Some tribes require people to be active in the community, to have lived there within a specific (recent) time period, to have been on a census going back to a specific period in time... They differ from one federally recognized nation to the next.
What I'm sharing is information. I don't "seem to be" saying anything in particular, other than to be informed about Native Nationhood, claims to Native identity, etc.
Miss Smillia points to DNA testing.
A lot of people are doing genetic testing for Native ancestry. Many think that if they find those "markers" they will be able to check the "American Indian" box on college applications, etc.
Course, anybody can check a box. But I don't know of any tribe that will put you on the tribal census if you walk in the door with that "certificate" of Native ancestry, based on a DNA test.
Those tests, as I understand them, aren't tribally specific. They don't provide that level of detail. It isn't possible, as I recall, to map DNA to that level.
Yes, Stephen, I did hear the NPR story... The interview with the Shoshone woman is interesting. It points to the problems ahead of tribal nations as their tribal members marry non-tribal members.